Since nobody can seem to agree on what is an asset bubble, it’s that much more difficult to try and estimate its end. A bubble stops being a bubble only when the people participating decide to question the rationalizations they’ve invented to keep them complacently inside of it. It’s most often just that vague sense the world isn’t turning out the way everyone was just the day before so sure it would. Combine that with ungodly valuations, it’s an ugly prospect.
The Dow Jones Industrial Average (DJIA) registered a record high on January 14, 2000. Bulls were encouraged by the confirmation it provided the tech sector from traditional economic quarters. Closing at 11,722.98, the index would, however, decline sharply over the next few trading sessions. By January 20, it was being pulled lower by “old economy” stocks like Alcoa, Procter & Gamble, and General Electric.
Analysts were confused.
Citing no fundamental reasons behind the sell-off, analysts linked the Dow’s plunge to big losses in several of the 30 firms that comprise the narrow index. Only seven Dow stocks rose.
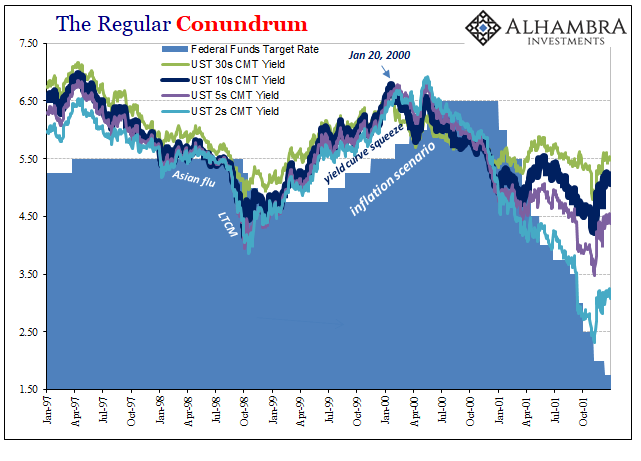
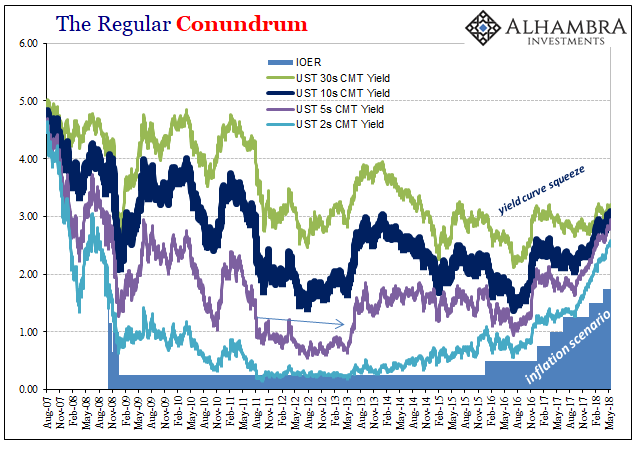
The bond market began to disagree with that sentiment. Stock jockeys could find no “fundamental reasons” for the reverse, but the US Treasury market had been displaying severe unease for months by then. The yield curve had collapsed under pressure from below by the Greenspan Fed’s inflationary scenario, one they had invented for themselves which the market was clearly rejecting.
January 20 marked the end of the yield curve buildup and the beginning of its inversion. It was this market throwing in the towel and uncertainty, declaring enough was enough.
The Fed, as they always do, kept going anyway regardless of that market signal as well as others from the stock market which joined in mere weeks later. The Dow wouldn’t see another record high for nearly six more years. The high-flying NASDAQ would set its final record of the dot-com era that March, and then wouldn’t get back to it for another fifteen years.
The promises of the “new economy” were not showing up in early 2000. The economy rather than surging perilously close to an inflationary breakout was heading instead toward the rocks of recession.
Learning absolutely nothing from the episode, when the cycle swung around in the middle 2000’s to about the same position, policymakers simply repeated everything they had done before. Though the position of Chairman had passed from Alan Greenspan to Ben Bernanke, in early 2006 Bernanke seemed intent on displaying just how little policymakers had evolved (which is to say not at all).
In March 2006, as the yield curve squeeze (flattening) bore down on the FOMC once again, in a speech to the Economic Club of New York he dismissed it all over. Guess what he blamed for the long end’s repeated refusal to get with the official program?
According to several of the most popular models, a substantial portion of the decline in distant-horizon forward rates over recent quarters can be attributed to a drop in term premiums. Using some of these models, we can further divide the term premium into two parts–a premium for bearing real interest rate risk and a premium for bearing inflation risk. Both of these components have trended lower over time as well, according to the standard models, but the decline in the premium since last June 2004 appears to have been associated mainly with a drop in the compensation for bearing real interest rate risk.
When in doubt, curse term premiums.
What really happened instead was pure risk assessment. Like the 1999-2000 conundrum, the Treasury market at the long end wasn’t sanguine as officials had been about economic and financial risks. Bernanke saw no housing bubble while most of the world, outside of those directly involved in it, couldn’t see anything but. Bond traders (mostly the banks themselves) were willing to give the Fed (based on perceptions of its past reputation) some leeway on it, but only so much and only for so long.
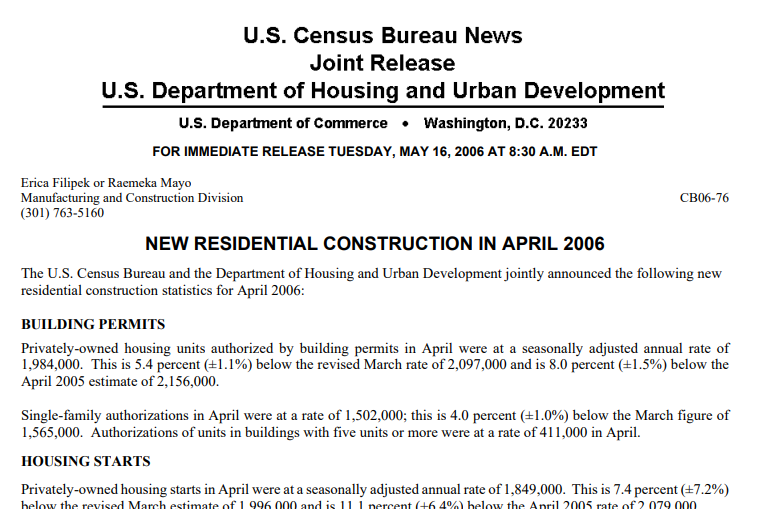
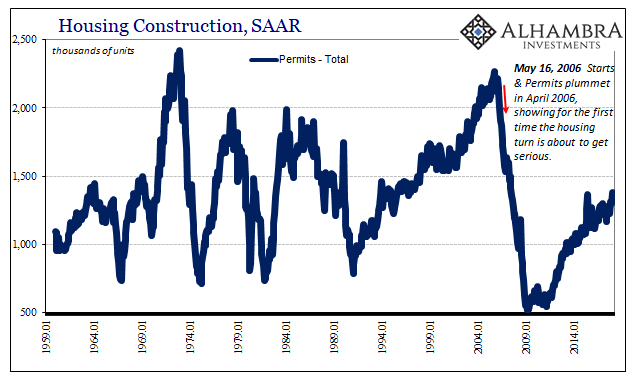
On May 16, 2006, the Census Bureau reported some really bad news. The housing industry had been on fire up until the latter half of 2005. The level of permits and starts began to level off, however. Though starting from an extremely high rate of construction plans, there were worries a turn in housing wouldn’t be just a minor nuisance in finance or the economy in general.
Permits for April were reported to have dropped 5.4% from March 2006; starts plummeted 7.4% in that one month. April 2006 marked the beginning of what would become the housing bust, a reversal that in many ways the world has yet to crawl out from under.
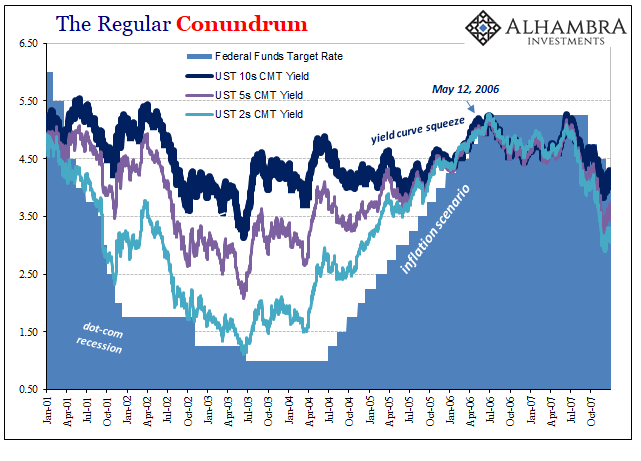
The 10-year UST yield had jumped to 5.19% on Friday, May 12, 2006, the highest rate in four years. I don’t remember any cries of BOND ROUT!!! but I’m sure there were some (especially from Bill Gross). Trading down to 5.16% on Monday, May 15, the Census Bureau release triggered a “flight to safety” bid pushing it down to 5.10% that Tuesday. It recovered somewhat the following day, but thereafter the long end squeeze was over and yield curve inversion was the next step.
That much was assured because Bernanke as Chairman, having already taken over from Greenspan, would push the FOMC to undertake one more “rate hike” at the end of June 2006. And though they professed nothing but confidence after that final one, they failed to go any farther while curve inversion told the world why.
It’s not term premiums; it’s never term premiums. Those are an invented concept Economists use largely as justification for how they can just ignore the glaring, blinding contrary determination of the bond market at absolutely the most crucial moments in economic history. That determination is about risks, pure simple, primarily those related to how policymakers at central banks don’t know what they are talking about.
It’s the market calling bullcrap on the official narrative.
Everything always recycles, since history because of the unlearned lessons of the past always repeated. It doesn’t appear quite yet that we’ve reached another inflection in bonds. We’re still, it would seem, in the yield curve squeeze portion where the market is telling policymakers to pay attention to risks they don’t want to acknowledge.
Janet Yellen at her final press conference in December 2017:
The yield curve has flattened some as we have raised short rates. It mainly—the flattening yield curve mainly reflects higher short-term rates. The yield curve is not currently inverted, and I would say that the current slope is well within its historical range…
So I think the fact the term premium is so low and the yield curve is generally flatter is an important factor to consider. Now, I think it’s also important to realize that market participants are not expressing heightened concern about the decline of the term premium, and, when asked directly about the odds of recession, they see it as low, and I would concur with that judgment.
It really doesn’t matter which one sits in the big chair. There’s always term premiums to rationalize everything.

Stay In Touch