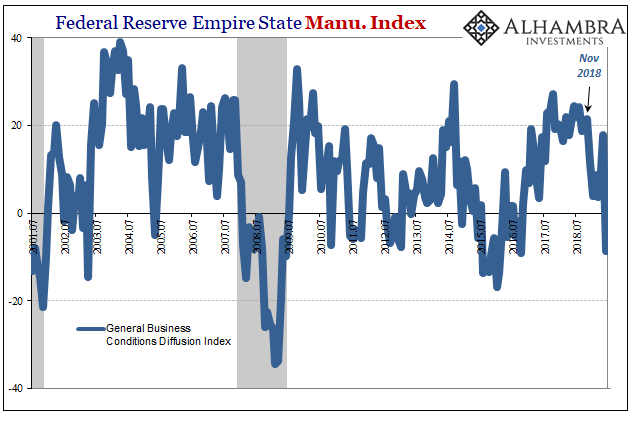
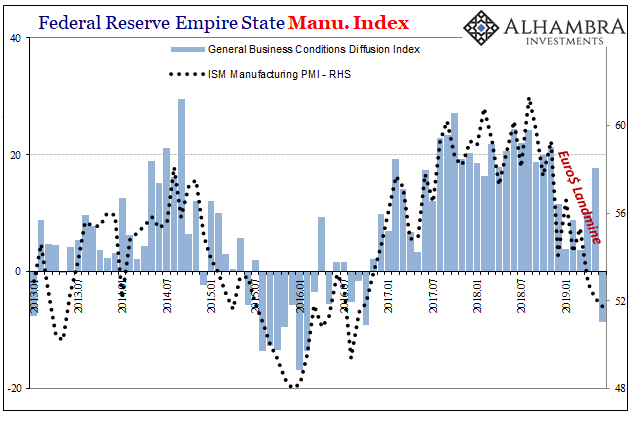
This green shoot didn’t wilt so much as it exploded into a fireball. FRBNY’s Empire State Manufacturing Index had captured the landmine in its initial 2019 readings. Starting from 21.4 (this version uses zero rather than 50 as its dividing line) in November 2018, by January the index had dropped 17.5 points in just two months. It then stabilized and by April was moving up again.
This rebound or green shoot pushed the PMI to 17.8 by May, almost retracing the entire landmine aftermath. No doubt it was one of the most widely cited statistics inside policy circles. One “cross current”, at least, seemed to have abated.
Two weeks ago, however, FRBNY reported the index’s largest plunge on record. Falling 26.4 points just in June 2019, it left the headline at -8.6. It was the first contraction indication since October 2016.

While certainly more extreme in its latest number, the Empire Fed survey isn’t an outlier. It was if only as a green shoot, so in declining so sharply last month the index was simply catching up or converging with other figures already sunk toward the economic depths.
One of those is the ISM’s Manufacturing PMI. Though the Empire Fed is a regional survey it often correlates with other measures of national conditions. Whatever might’ve been picking up in New York State wasn’t something widely shared.
The ISM reports today that its latest reading for June 2019 is 51.7. That’s the lowest since September 2016. And like many if not most of the other PMI surveys, this one picks up the landmine, too.

One comment from the press release says it all: “Comments from the panel reflect continued expanding business strength, but at soft levels.” They just add the word “strong” or “strength” to each and every statement out of habit, the Pavlovian response to now the official characterizations. Like the word “transitory”, in any economic context it has lost all meaning. Thus, for June, the ISM reports soft strength.
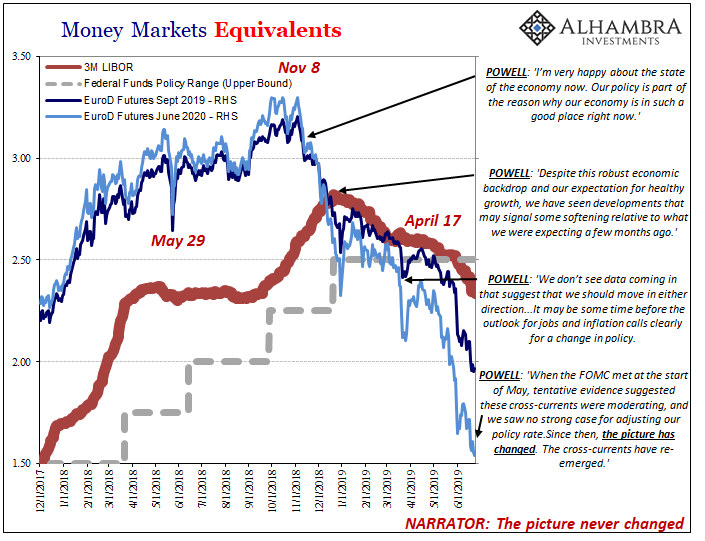
This can’t be trade wars. The last upswing peaked last summer and in November 2018 the ISM index was still above 59. While bond curves distorted and inverted last December, this manufacturing measure dropped more than 5 points. According to the ISM, this green shoot peaked in March, too.
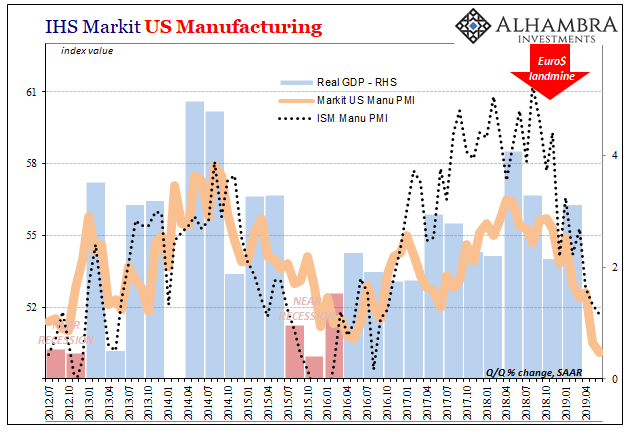
This is significant because the ISM’s estimates for US manufacturing were far and away the most optimistic. Those compiled and reported by IHS Markit, for example, never came close to achieving such lofty heights during 2017 and 2018.

But if the various surveys were in disagreement over how good Reflation #3 might have been, there is no space between them as to Euro$ #4. Nor do they diverge as to when this global dollar shortage began showing up (around April/May 2018) and when it really took hold of global trade and manufacturing (the landmine).
During Euro$ #3, the ISM didn’t get down around 51 until August 2015. Markit’s PMI is already its lowest since 2009. The Empire Fed right now is equivalent to 2015, weaker than at any point in 2012 or 2013. No matter which way the prevailing winds blow in the will they/won’t they news cycles about trade politics, the curves all say this is just getting started.


Stay In Touch