But how do we know when irrational exuberance has unduly escalated asset values, which then become subject to unexpected and prolonged contractions…
– Alan Greenspan, The Challenge of Central Banking in a Democratic Society, at the Annual Dinner and Francis Boyer Lecture of The American Enterprise Institute for Public Policy Research, Washington, D.C., December 5, 1996
Are investors too optimistic? It seems strange to ask that question at a time when so many Americans believe the economy is performing poorly and consumer sentiment is at levels that, in the past, were reserved for much worse conditions than we have today. But stocks are at all-time highs – and near all-time high valuations – for a reason and it isn’t because things are awful. The year-over-year change in real GDP over the last four quarters has averaged 3.1% and since the 3rd quarter of 2021, it has averaged 3.2%. Yes, some portion of that was coming off the low base of COVID but it is four years of solid growth, well above the 2.4% we averaged during the 2010-2020 period. Has that high growth positively skewed investors’ perception of the future? The valuation of the S&P 500, currently near dot com era levels, certainly points in that direction.
The pessimism we see in the consumer sentiment polls is not driven by growth but rather inflation. Over the last four quarters, while GDP was growing at a 3.1% pace, prices were rising at 3.2% which isn’t great on the inflation side, but with unemployment low and real wages rising, it’s pretty good overall. But during the longer period since the third quarter of 2021, while GDP grew at a 3.2% pace, inflation averaged 5.4% per year. The good growth over the entire period is overshadowed, in many people’s minds, by the bad inflation of 2021 and 2022. The misery index (the inflation rate over the last year + the unemployment rate) has been improving steadily since peaking in the summer of 2022 at 12.6. Today it is at 6.5 and falling. Over the last four quarters it has averaged 7.1, which is better than the average of every decade since 1970. If that continues, the GDP growth is likely to continue as well and consumer sentiment should improve.
Misery Index
| 1960s | 7.1 |
| 1970s | 13.3 |
| 1980s | 12.8 |
| 1990s | 8.8 |
| 2000s | 8.1 |
| 2010s | 8.0 |
| 2020s | 9.3 |
| Last 4 Quarters | 7.1 |
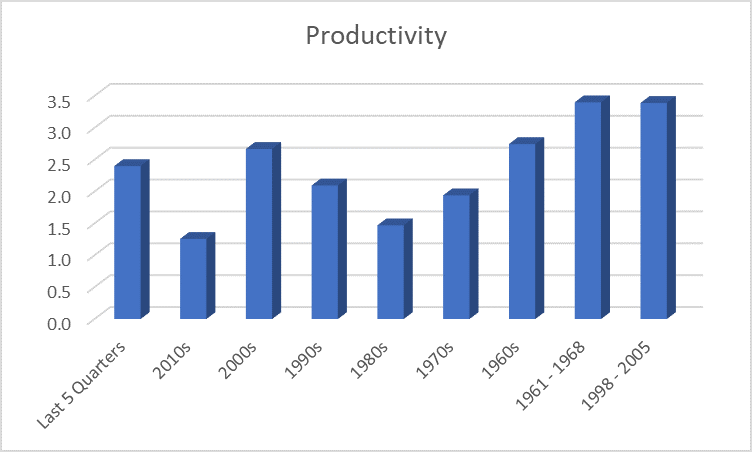
Today’s optimism, reflected in high stock market valuations, is not driven by past growth or concerns about inflation but rather by expectations that AI will dramatically improve productivity. The market – investors – believe that the current productivity growth rate (2.4% over the last 5 quarters vs 1.3% during the 2010s) will be maintained and so, therefore, will the recent GDP growth rate. The most optimistic out there suggest that AI could drive productivity gains well beyond what we’ve seen so far. In their view, today’s GDP growth rate is a floor, not a ceiling.
There have been several innovative periods of high productivity growth in the past that drove economic growth higher. The 2000s are remembered as a time of weak GDP growth (1.8% average over the decade) but the average growth rate for the decade was brought down by the 2008 crisis. The real surge in productivity from the dot com boom came from 1998 – 2005 (and maybe a little earlier) when growth averaged 3.2% and productivity rose at a 3.1% rate. We also have the period in the 1960s from about 1961 to 1968 – another period of rapid technological development – when productivity grew 3.4%/year and real GDP growth surged 5.2%/year. If the widespread adoption of AI has a similar impact, today’s stock market optimism may well be justified.
AI has likely played some role in the recent growth spurt because of the investments being made today in things like data centers and electricity generation to accommodate the future needs of an AI-driven economy. Of course, that future AI economy hasn’t arrived yet and that’s why so many people, myself included, look at today’s valuations and think AI better prove out or the downside in stocks is going to be large. I also look at continuing budget deficits running at over 6% of GDP and wonder how much of this growth is sustainable if the deficits aren’t. Those deficits have, no doubt, raised today’s growth rate and corporate earnings. The question that is yet to be answered is whether the deficits have produced investments that will pay off in higher growth or whether today’s growth has just been borrowed – pun very much intended – from tomorrow. I am always skeptical of government-led investment so I have my doubts, but I also don’t doubt that the next President, whoever it is, will keep spending until the bond market says no mas. Large deficits are sustainable until they aren’t and I have no idea when that day will arrive.
Stocks – particularly large cap stocks – are expensive compared to almost all of the known history. But are they too expensive? We’re going to start seeing firms update their capital market assumptions for 2025 and beyond soon and you should expect everyone to project low returns for the S&P 500 over the next 10 years. As JP Morgan put it in their recent report:
Starting at a higher (valuation) level lowers return expectations, all else equal.
I would suggest that the most important part of that sentence is at the end, “all else equal”. High valuations today do not assure that future returns will be sub-par. It merely means that investors today are optimistic about the future (which, given the current election rhetoric, may be the biggest instance of cognitive dissonance in all of history). If investors are too optimistic, future returns will likely be low compared to long-term averages. If not, then all else isn’t equal. Is today’s optimism unwarranted? Maybe. Maybe not. But when you see those projections of below average future returns, that is the implied assumption. While it is hard to imagine, it could be that today’s optimism is not only warranted but understated. In 2016, almost all the 10-year outlooks called for S&P 500 returns of 6-7%. JP Morgan, for instance, pegged future returns at 6.5%. There were plenty of very smart people projecting even lower returns. All of those expectations were wrong and not by a little. The actual return since then has been 14.6% per year. As William Goldman, Oscar winning screenwriter of All The President’s Men and Butch Cassidy and the Sundance Kid, once said, “nobody knows nothin”.
JP Morgan today pegs equity returns at 6.7%/year over the next 10 to 15 years, a number remarkably similar to their projection in 2015. If you wonder why that is, consider that the long-term growth rate of earnings is, you guessed it, 6.5%. JP Morgan rarely ventures very far out on the arboreal appendage. Goldman Sachs also released their projection for the next 10 years and they are even more pessimistic, looking for a nominal return of 3%/year. While both firms mention AI as providing a boost to growth over the next decade, neither thinks it is a large change with JP Morgan expecting AI to raise growth by just 0.2%/year. If that turns out to be true, the amounts being spent on AI today will look pretty foolish.
I don’t know what the ultimate impact of AI will be and neither does anyone else. It could be a paradigm shift for the ages or, as JP Morgan reckons, a modest boost to growth. How should we invest in a situation with such a wide range of potential outcomes? We diversify, we spread our bets across multiple asset classes and wait for trends to emerge. Right now, with interest rates and the dollar stable and providing little tactical guidance, investors should stick close to their long-term strategic allocation. Don’t get caught up in the AI hype and don’t succumb to the negativity of the political campaigns. Both are likely exaggerated.
Joe Calhoun
P.S. Alan Greenspan’s answer, by the way, is we don’t. We can’t know whether today’s asset prices are justified but “we should not underestimate or become complacent about the complexity of the interactions of asset markets and the economy”.
Environment
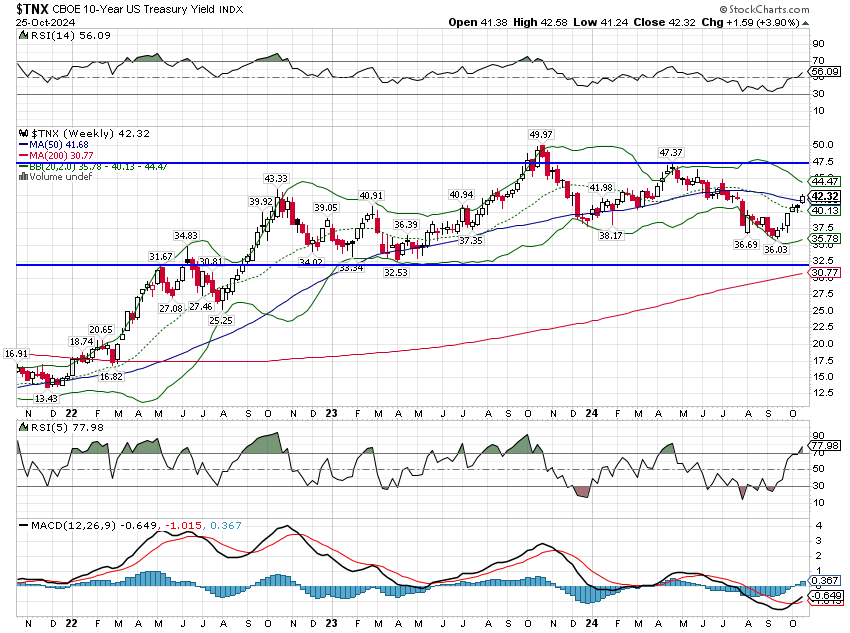
The 10-year Treasury yield rose by 16 basis points last week on the back of, well, basically nothing. The economic data was really on the weak side, highlighted by existing home sales that were the weakest since 2010, which wasn’t a very good time. The Chicago Fed National Activity Index was below zero indicating growth below trend and two regional Fed surveys were also below the zero line. So why did bonds sell off? I don’t know because I can’t get inside the heads of the all the people trading bonds but the popular narrative is that the selloff is based on an expectation that Donald Trump will win the election. The thinking is that his proposed policies would be a) better for growth, b) worse for inflation, c) bad for the deficit, d) irritating to foreign buyers of US Treasuries or e) all of the above. I’d suggest the likely answer is e) because I don’t have a clue what he would really do if elected again. Of course, the same could be said about Harris so maybe there are other reasons for bonds to sell off. Whatever the reason, the meaning is clear – the market doesn’t believe that NGDP growth is going to slow.
Is that bad? Well, it depends on how much of that NGDP growth is inflation and how much is real growth. Real growth has grown faster than inflation over the last 3 quarters and is highly likely to do so again in Q3 24 but how it will do under a new administration is impossible to know without knowing exactly what policies will be enacted. Frankly, even if we knew exactly what policies would be enacted by a new American administration, we might not know the impact because we’d also have to know how the rest of the world would react to the policy change. You can be sure, for instance, that if Trump really imposes 20% tariffs on all imports, other countries will retaliate but we can’t know how they would do so. In any case, we can’t even have a clue what policy will be like after the election without also knowing the makeup of the future Congress. And if someone tells you they know how all this is going to come out, they are either lying or delusional. And if, to quote ZZ Top, you heard it on the X, it’s probably both.
The fact is that last week changed nothing. Interest rates are right in the middle of the range they’ve been in for two years. What that looks like to me is status quo – which isn’t all that bad right now.
The dollar also rose last week, back over 104 and also right in the middle of its own 2-year (mostly) range. The dollar might be more of a tell that the market is anticipating a Trump victory since, at least in theory, tariffs are positive for the currency of the country imposing them. Of course, ceteris is rarely paribus and tariffs are rarely imposed by only one country. I wouldn’t read too much into the movements of the dollar or rates as long as they stay in these ranges. Stability is a good thing.
Markets
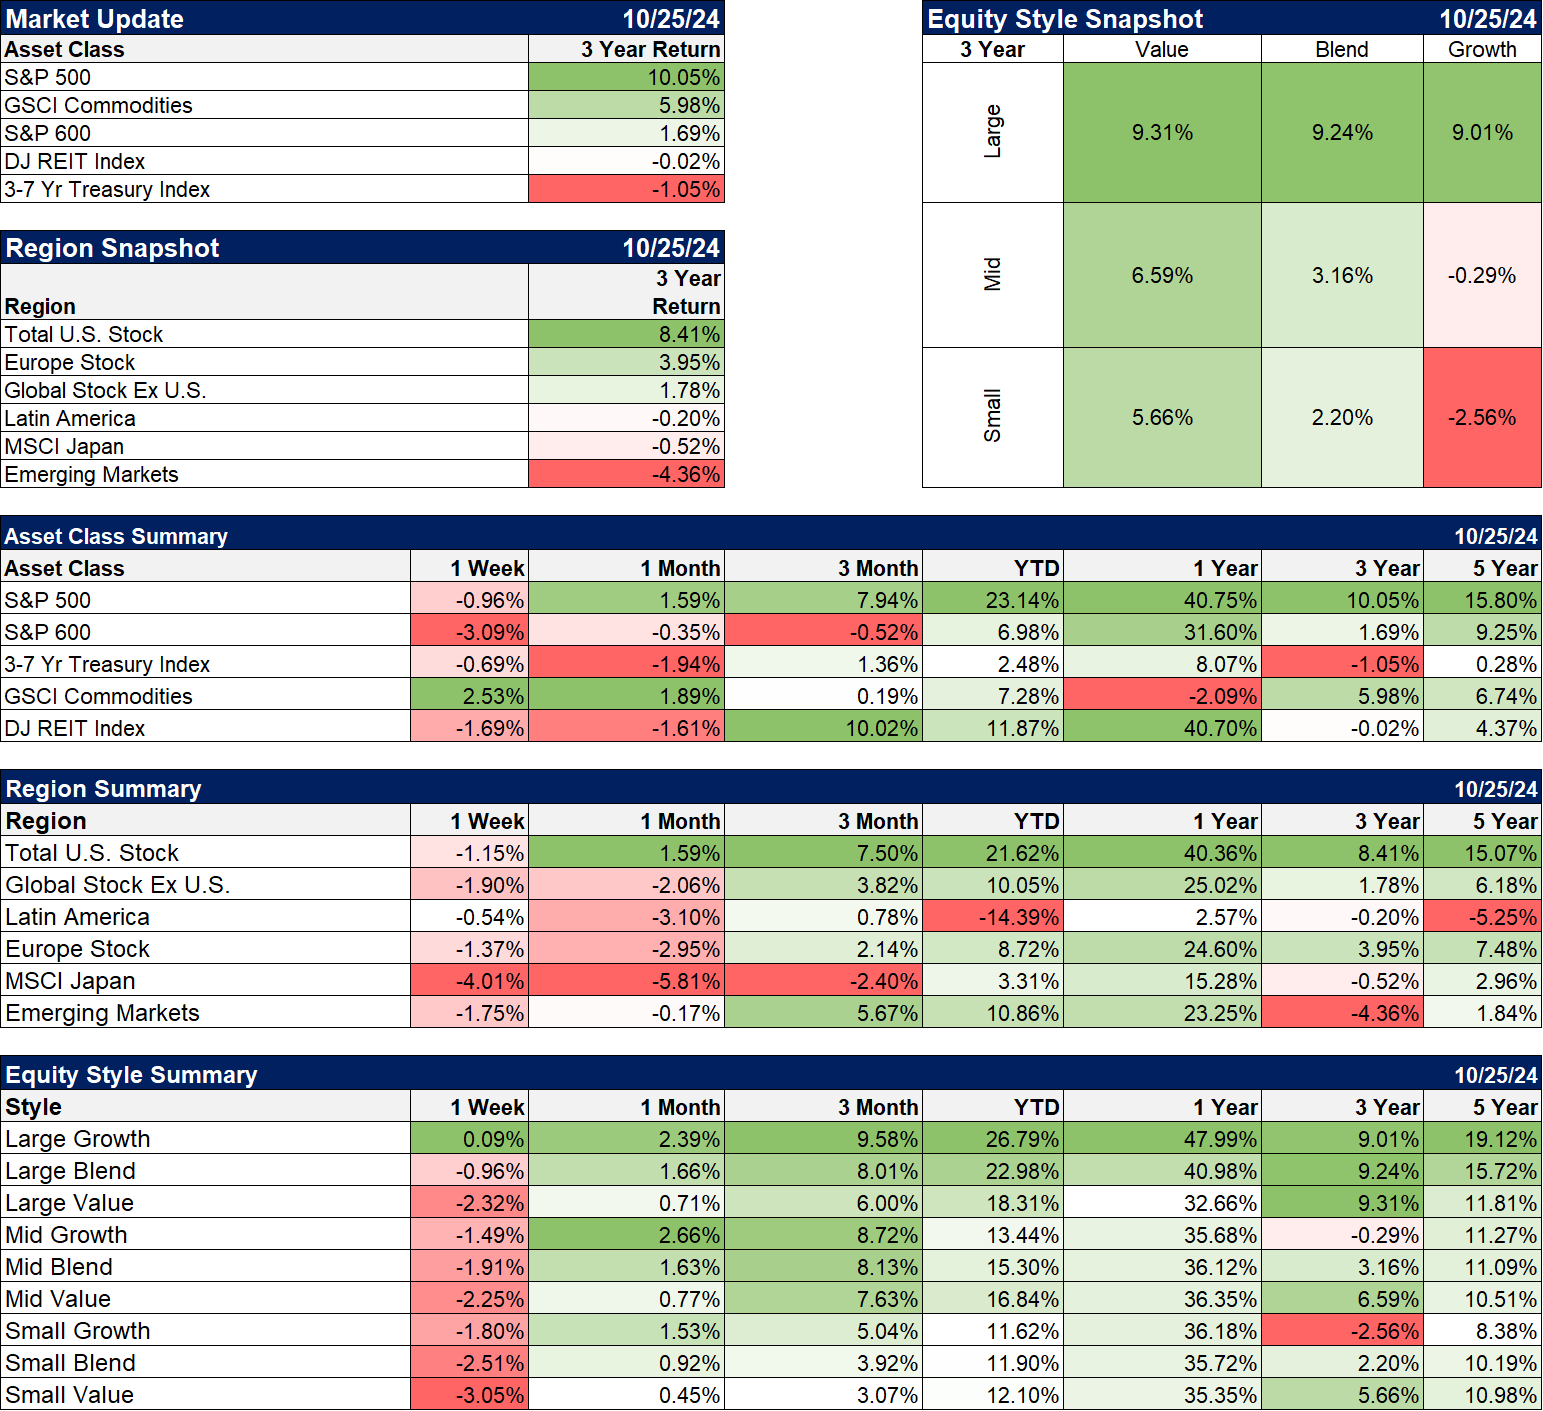
The only asset class that managed a gain last week was commodities. Stocks, particularly small caps, were weak and REITs responded negatively to higher rates. The good news is that sentiment that was way too bullish last week, cooled considerably in just one week. I had thought we’d see some kind of correction in stocks after the election but it may come before. We saw a pick up in hedging last week so investors are starting to worry about something although it doesn’t have to be the election. On the other hand is anyone thinking about anything else right now? I have been tempted to do some hedging of my own but if everyone else is doing it, I’ll probably pass. We’ll see how things go next week.
I’m highlighting 3-year returns this week just to remind everyone how difficult the last 3 years have been for anyone who dared to own anything other than large cap stocks. It hasn’t mattered much whether you owned value or growth (value has a small lead over that time) but everything else did nothing but reduce your returns. A moderate risk diversified portfolio has returned 2 to 4%/year over those three years so it has been frustrating for investors trying to control risk. The good news is that in the world of investing, three years is a short time frame within which almost anything can happen and it doesn’t say much about the next three years.
Sectors
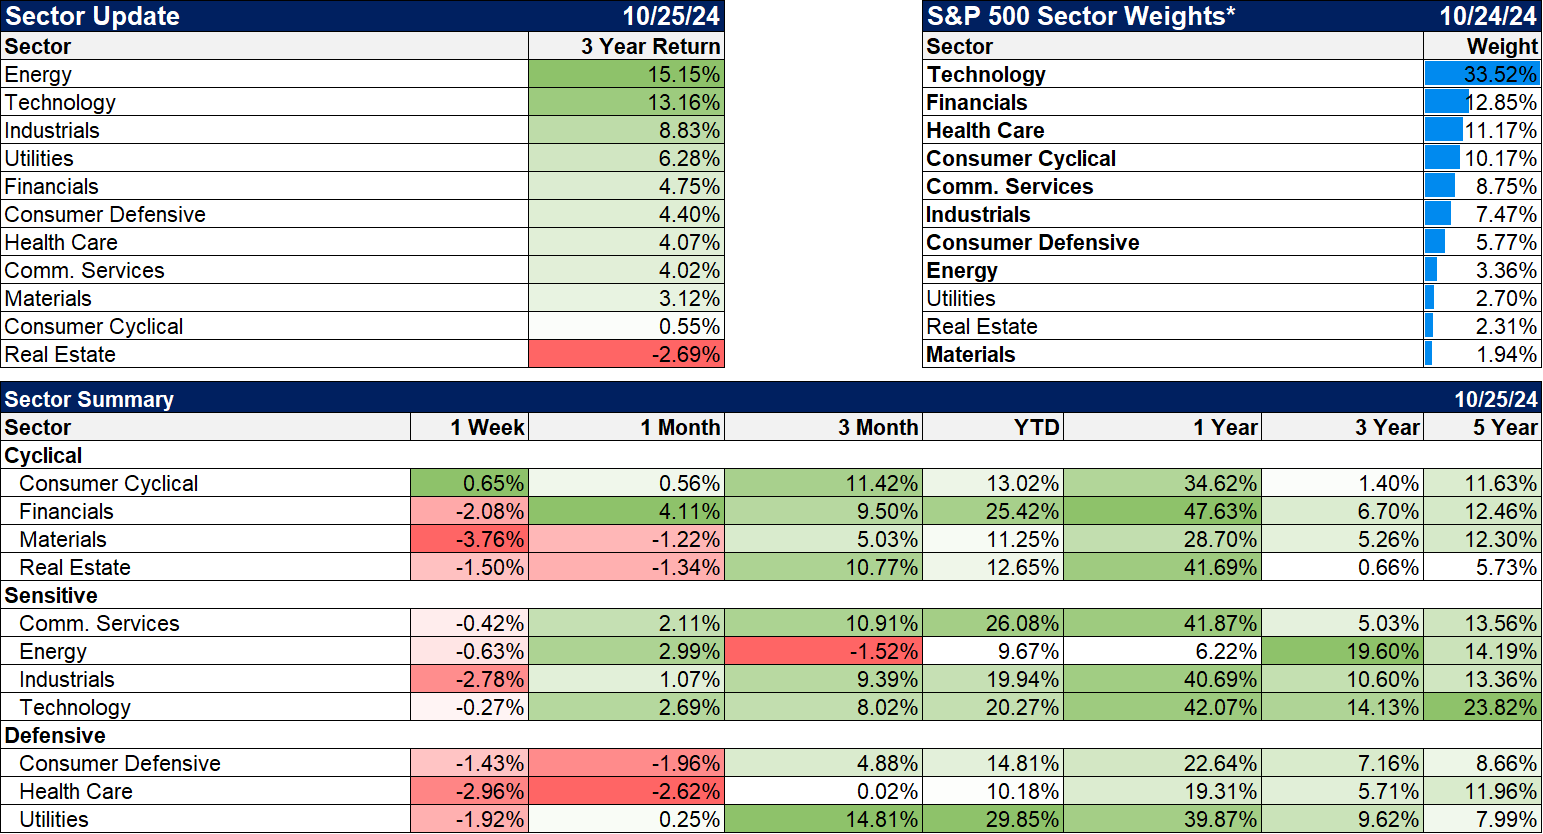
Consumer cyclicals were the only sector higher last week which is almost entirely attributable to Tesla.
Note: The returns listed in the top section labeled Sector Update, are annualized price returns. The returns listed in the Sector Summary are annualized total returns. I’ll be talking to our vendor about that.
The only double digit returns over the last three years were in energy, industrials and technology. Utilities, a defensive sector, came close at 9.6%. Most of the other sectors were in the mid-single digits.
Market/Economic Indicators
Mortgage rates have ticked back up to over 6.5% and mortgage applications are falling off a cliff again. Reviving the housing market will require one of three things:
- Lower financing costs
- Lower real estate prices
- Time
Most likely outcome in my opinion is a combination of all three. Rates could still come down more even if the 10-year Treasury yield does not; the spread to the 30-year mortgage rate is wide compared to history. Prices may fall in some areas (I’m looking at you Florida) but if they stop rising and incomes don’t, then houses will get more affordable. The last one, well, time marches on and life happens. Baby boomers will die and their kids will sell the house. People will get new jobs and have to move. If rates don’t come down, eventually we’ll all adjust.
The economic data wasn’t great last week but there were some glimmers of positive signs. The Richmond and KC Fed surveys were still negative but better than expected and an improvement from last month. Jobless claims did not spike after Hurricane Milton but that might just be delayed. Existing home sales were terrible but new home sales were better than expected. Overall, the picture on the economy didn’t change much. The latest Atlanta Fed GDPNow, updated Friday, is 3.3% for Q3.
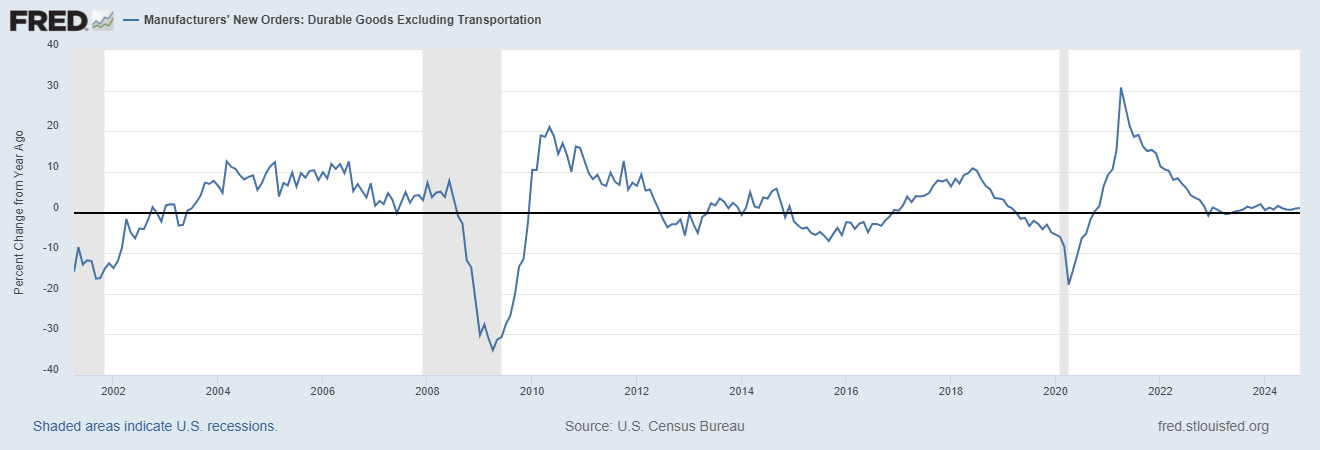
Our system didn’t update the durable goods figures so I added this updated chart. As you can see, durable goods orders ex-transportation (ex-Boeing) have been running flat for almost two years. That’s a function, at least partially, of the weak housing market.





Stay In Touch