
Given the weak state of the economy and its relation to so much monetary “stimulus”, it is still amazing that the standards for positive economic performance or momentum have been so drastically reduced. The durable goods report is a perfect example. There is no doubt that some manufacturing activity has ticked up after the disastrous months of February and March. But doing better in April and May is decidedly not the same thing as a recovery track.
Ex-transportation, total durable goods orders were up 3.11% in May Y/Y, following a 2.81% rise in April. Shipments increased a little less robustly, but still positive Y/Y: 0.57% in May after 2.31% in April. While that may be cause for optimism for some, those rates pale in comparison even to a relatively weak 2012: shipments in May and April 2012 were 8.26% and 6.93%, respectively; orders in May and April 2012 were 5.03% and 7.43%, respectively.
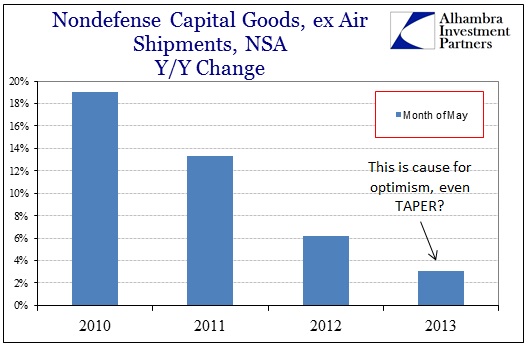
Even capital goods orders, where some see further recovery, are running well below what would reasonably be considered a “growth” trend.
Extending the context, this is not just a one-month inclination.
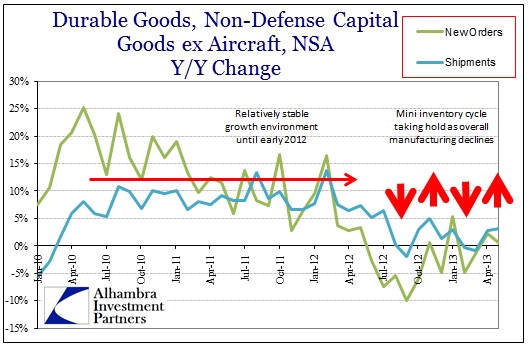
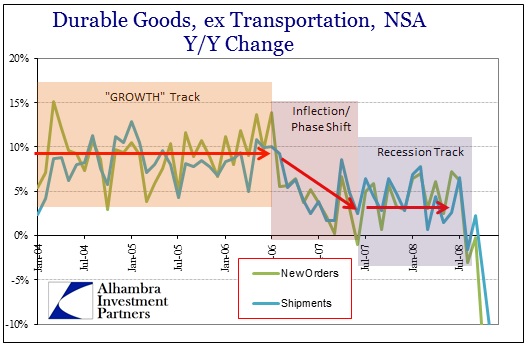
In fact, what is plainly apparent is that since the middle of 2012 the track of “growth” in the good economy has changed. What appears to be rebounding activity is nothing more than mini-cycle volatility around this new trend.
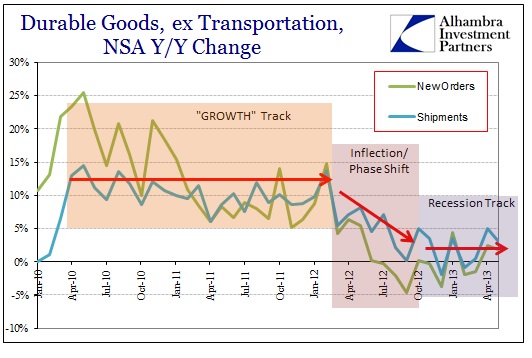
Despite any perceived improvement in April and May, these months are contained within what appears to be a recessionary track or environment. If the chart above was not clear enough on that point, combining the “good” months with the “bad” months for YTD comparisons shows the scale or degree to which momentum has been lost.
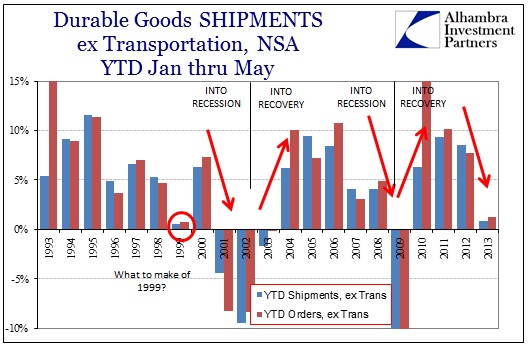
On a YTD basis, 2013 is running quite behind even the first five months of 2008. Outside of the drop in comparisons in 1999 (which I will circle back to below), 2013 activity is on par with recessionary levels. Amazingly, the inflection and change into that recessionary track is strikingly similar to the 2006-08 period.
In fact, if we plot them together they are nearly indistinguishable.
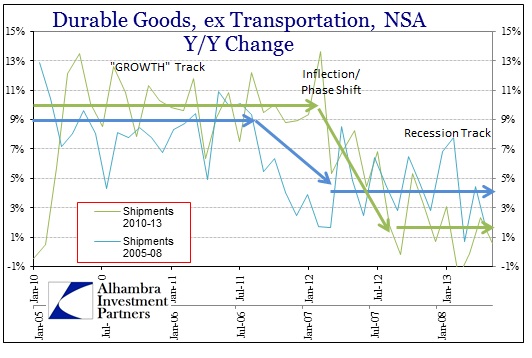
I’m having a real difficult time, particular with this comparison in mind, seeing where optimism regarding a rebound can be coming from. There is a lot to be said about levels of activity that are consistently running worse than 2008. Again, what we are really seeing is the normal course of month-to-month volatility around a central tendency; true in 2012-13 as it was in 2007-08.
In both periods there were clear growth tracks that were associated with recovery or “boom” cycles, giving way to a period of inflection or phase shift to the lower track consistent with previous recessions. Any change, even over a two-month period, has to be seen and analyzed in that context to be valid.
The appearance of similar weakness in 1999 is an entirely different occurrence.
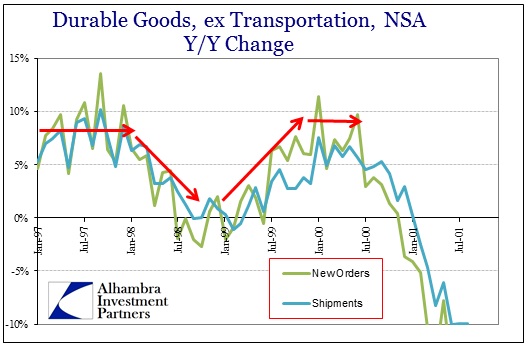
It was a temporary interruption in the growth trend due in no small part to Asian flu. It occurred against a backdrop of rising income and, perhaps more importantly, asset inflation that was driving business “investment” and household indebtedness. The character of asset inflation and its mal-effects were also entirely different – the dot-com bubble was driving business investment in the real economy (thus the sharp rebound or goods and capital investment into later 1999 and 2000, only to drop off a cliff during the dot-com bust) where business investment in 2013 consists of repurchasing stock domestically or increasing productive capacity overseas.
Further, there is no monetary channel for new credit to flow to households to supplement income as there existed in the late 1990’s. Again, like 2008, the lack of channels “supported” the economy’s resistance to monetary interference, rendering the recession tracks far more durable (pardon the pun) than 1999.
I suppose there is comfort that these data points are not below zero, but that doesn’t get the economy very far. I believe that there is an obtuse inattention to context, both recent and historical, that allows this theory of a real recovery to exist wholly in ignorance. It may be technically true that the data has improved in April and May, but like so many other economic parameters, that is an intentionally lowered standard of judgment.
Click here to sign up for our free weekly e-newsletter.
“Wealth preservation and accumulation through thoughtful investing.”
For information on Alhambra Investment Partners’ money management services and global portfolio approach to capital preservation, contact us at: jhudak@4kb.d43.myftpupload.com
Stay In Touch