
Second quarter preliminary GDP estimates were revised upward over the advance estimate, from 1.7% to 2.5%. Based on trade data released in the past month, this is not much of a surprise, though the size of the revision is somewhat larger than expected. Of course, because the purchase of imported goods (and a few services) is negative in the GDP accounts, less domestic demand in this case translates into rising GDP.
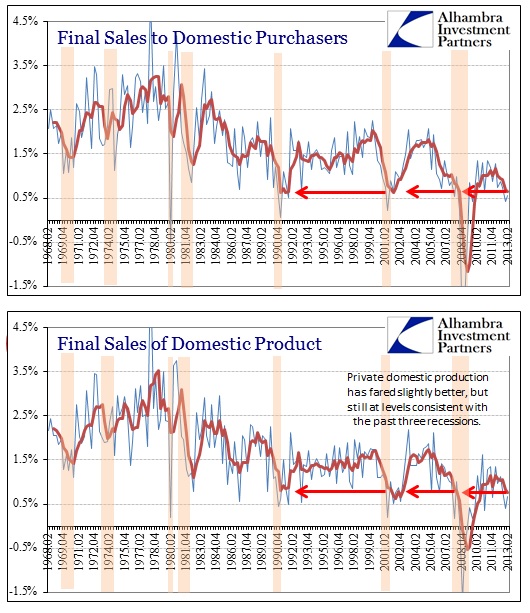
Absent that international trade quirk in GDP measurement, we can gauge the actual private economy’s internal demand and supply. Not only does this account for imports/exports in a more intuitive manner, it strips out business activities including inventory stocking/destocking (there are number of problems with how GDP handles business spending or “investment”). Internal demand of goods and services no matter where they are produced is measured by “Final Sales to Domestic Purchasers”; the supply side is estimated in “Final Sales of Domestic Product”.
I often refer to these accounts as a better measure of economic performance, particularly the removal of government actions (which actually has been a drag on GDP in more recent quarters). The economy looks pretty bad from the perspective of Final Sales, both demand and supply.
Narrowing our focus to more recent years, the pattern and trend in final sales is extremely similar to that of 2007-08.
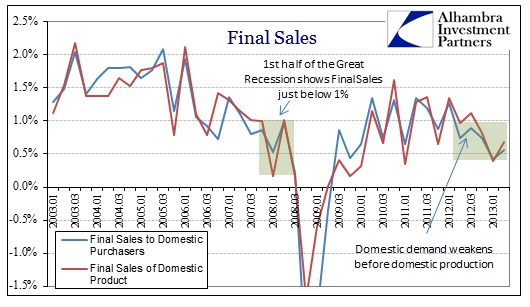
In each time period, growth in final sales, both private supply and demand, fall below the 1% level and remained there. Upon closer comparison, the trend currently is almost identical to the first half of the Great Recession.
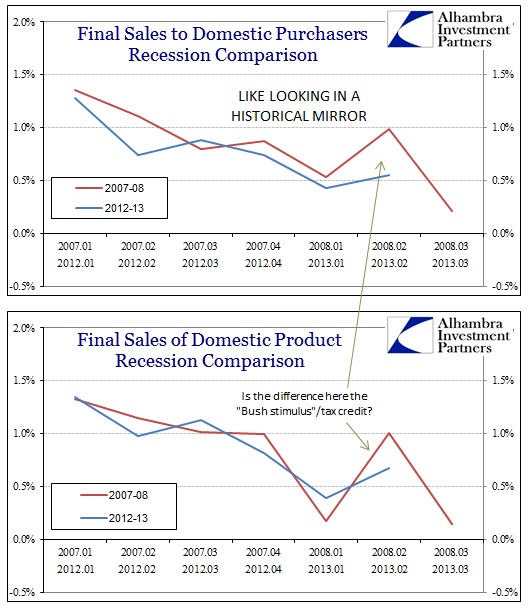
It’s very curious to see how the performance in 2012-13 can match so closely the advance and first stages of the Great Recession. However, comparing conventional views on the economy across these two timeframes does not conform so neatly. The reason is the simple calculation of official inflation.
Because the official inflation rate was deemed to be more evident in the first half of the Great Recession, it acquired that connotation and conventional agreement. So, in nominal terms the current period is exactly like 2007-08, but accounting for differences in inflation estimates one is recession and the other is “muddle”.
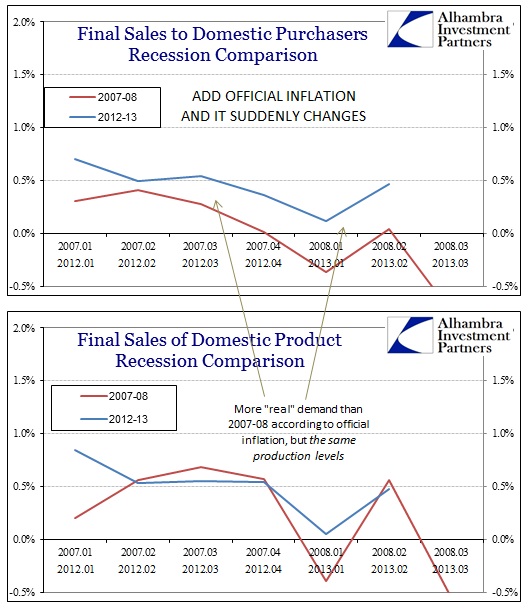
Further, there is a noticeable difference in the inflation figures between just demand and supply. In “real” terms, the measure of internal demand looks much worse in the 2008 period compared to current quarters, yet there remains a high degree of similarity on the supply side. Does there really exist a different inflation level for demand and supply?
In conventional economics, the answer is “yes”. By any real or intuitive measure, the answer would be “no”. I’ll save that argument for some other time, but right now the conventional narrative about recession in the United States is totally dependent on the current measurement of official inflation – and only on the demand side. In terms of production, real or not, the track in 2012-13 is again identical.
That’s a pretty precarious position to stake out optimism and confidence in future economic performance. And it is largely an academic question, but it does offer an extremely plausible reason why this “feels” like a recession that is somehow not measured as one. No matter how you look at it, growth has slowed to pre-collapse 2008 levels; we are only left to quibble over the calculation of inflation knowing full well that the official inflation measures are largely shortcuts to obtain usable numbers out of a chaotic system.
One other note in comparing time periods, the effects of the previous housing bubble are obvious.
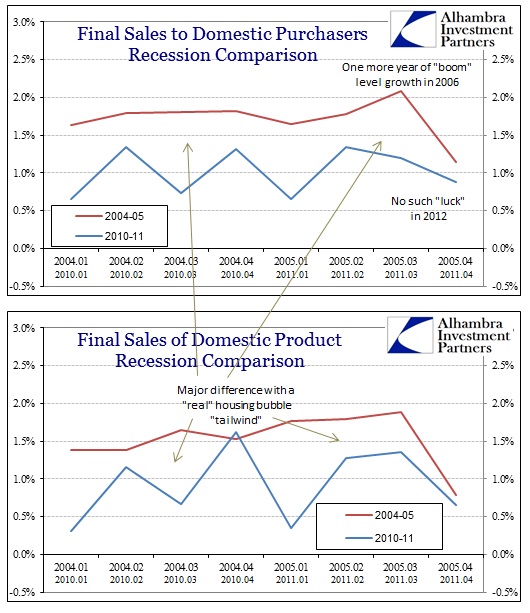
Despite lackluster growth in real wages and earned income, economic growth is a full level higher in the previous bubble period. The introduction of so much free flowing credit and debt was an artificial boost to economic performance – so much so that where 2011 transitioned into a 2008-style slowdown, there was another full year of “boom” growth after 2005. So not only did economic growth in the big housing bubble outpace the current mini-housing bubble economy, it got an extra year of it. Monetary policy deems that as a successful episode of economic engineering and central planning, which means QE 3 was more than a nostalgic longing for the “good ol’ days” (when monetary transmission was totally unclogged, wide open and flowing).
Given the recent performance of actual business revenues and earnings, I’m pretty sure the academic calculation of inflation on only the demand side is not enough to base a growth case. In fact, the historical comparisons in business results actually argue for economic performance below the 2007-08 comparison. All it would take is a minor change in the inflation variable on the GDP model for the conventional narrative to shift; businesses have to contend with economy as it actually exists.
Click here to sign up for our free weekly e-newsletter.
“Wealth preservation and accumulation through thoughtful investing.”
For information on Alhambra Investment Partners’ money management services and global portfolio approach to capital preservation, contact us at: jhudak@4kb.d43.myftpupload.com
Stay In Touch