
The NBER considers employment and incomes as the two primary indications of economic cycles. Contrary to conventional thought, a recession is never defined as two consecutive quarters of negative GDP. In issuing its November 2001 declaration for a cycle peak dated to March 2001, for example, the NBER said,
“A recession is a significant decline in activity spread across the economy, lasting more than a few months, visible in industrial production, employment, real income, and wholesale-retail trade. A recession begins just after the economy reaches a peak of activity and ends as the economy reaches its trough. Between trough and peak, the economy is in an expansion. Expansion is the normal state of the economy; most recessions are brief and they have been rare in recent decades.
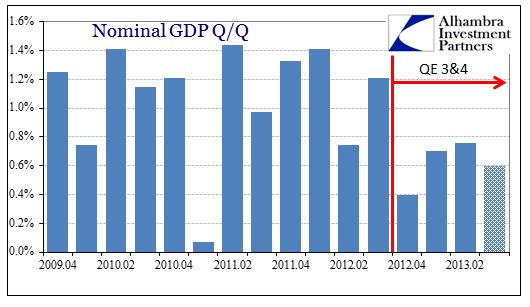
“Because a recession influences the economy broadly and is not confined to one sector, the committee emphasizes economy-wide measures of economic activity. The traditional role of the committee is to maintain a monthly chronology, so the committee refers almost exclusively to monthly indicators. The committee gives relatively little weight to real GDP because it is only measured quarterly and it is subject to continuing, large revisions.” [emphasis added]
When assessing cycle peaks and troughs, the committee studies first and foremost employment indications. Because employment is a lagging indicator, the NBER is frequently lagging in its cyclical determination. The rationale for using employment is rather simple, owing to the breadth of economic sectors incorporated into one data point.
As I established in my prior post, however, there is sufficient indication that current employment statistics are overstating monthly employment gains. I highly doubt the NBER, staffed with conventional and orthodox economists, would agree with that assessment, meaning there would likely be an even greater lag in any cyclical determination for 2012-13. The benchmark employment revision for 2013 was positive, afterall, even if that was solely due to the sudden appearance of nannies. Absent the nanny-effect, the revision was actually negative, but certainly nothing that would perturb NBER economists.
Aside from employment, personal income is given the most weight in considerations. Specifically, the committee uses real personal income less transfer payments as the primary signal. This makes sense because they are trying to measure the level of activity in the private economy, and increasing transfer payments (largely from gov’t) would actually indicate softening economic fortunes.
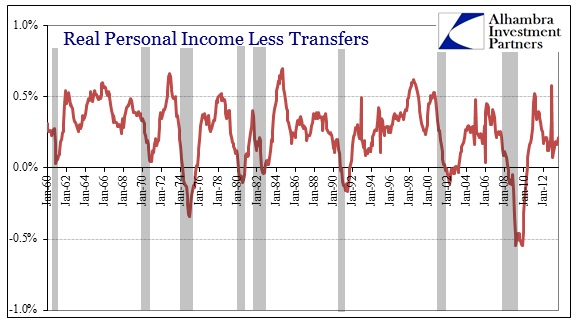
Indeed, declines in the growth rate of real personal income less transfer payments have corresponded with every single declared cycle peak. The current Y/Y growth rate of 2.4% (August) is a bit higher than every other month since mid-2012 (excepting the irregular income payments in November and December relating to tax rate/law changes). Since May 2012, real personal income less transfer growth has remained under 2.6%.

If we use 2.5% as a threshold for weakness, there have only been a few occasions where income growth has been as weak as it has since the middle of 2012.

If we remove declared recessions, that only leaves six other instances. Five of those were very short, one-month drops in income growth. That would be the very definition of temporary, so if we exclude those instances that leaves only 1993-94 as the only instance of non-recessionary/more-than-temporary circumstances.

Coincidentally, that period occurred in a jobless recovery, and lasted 15 months. The current iteration (again ignoring the end of 2012) is also 15 months. Perhaps that would buoy the assertion that further recovery is, in fact, just around the corner. However, there are striking differences that judge the comparison largely invalid.
Not the least of which is the economic circumstances themselves. The economy in 2013 is absolutely nothing like that of 1994. Debt saturation was only in the beginning stages, and there was the realization of computer/telecom revolution driving new industry growth and tech advancements (productivity) that simply do not exist today. In the parlance of the FOMC, there were far more “tailwinds” in the 1994 scenario.
I would go a step further as well since the debt usage in the 1990’s was far more skewed toward productive investment because of that technology/innovation curve, yielding far more growth, sustainable at that, in the real economy of that age. In 2012-13, debt usage is largely confined to students staying out of the economy (in lieu of finding a job after college graduation) and, to a much greater degree, corporate share repurchases.
So where there were “tailwinds” to push incomes back firmly in the “boom” model, none are present now nor any comparable substitutes (though economists would note QE, but results suggest QE is, at best, ineffective or, at worst, part of the problem). Since income growth below 2.5% typically indicates recessionary levels of weakness, it validates the idea that employment growth is likely overstated (if not in quantity, at least in quality). Further it also suggests the trajectory is not upward, but downward.
Getting back to the NBER, they also refer to both industrial production and the volume of manufactured goods as primary indicators. Using these three together, it cements the idea that the trajectory is moving in the “wrong” direction (and opposite 1994).

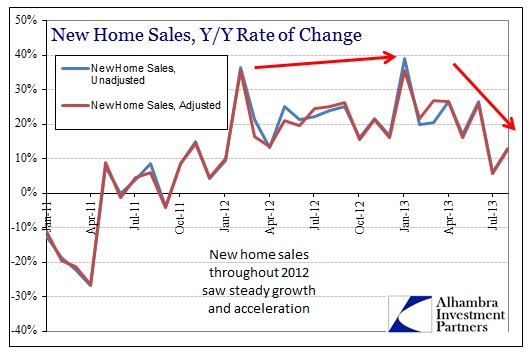
Using the NBER’s own stated criteria, the economy is not projecting a lot of optimism here at all. That is particularly true in light of QE’s impotence and a housing sector heading toward possible retrenchment.
Click here to sign up for our free weekly e-newsletter.
“Wealth preservation and accumulation through thoughtful investing.”
For information on Alhambra Investment Partners’ money management services and global portfolio approach to capital preservation, contact us at: jhudak@4kb.d43.myftpupload.com
Stay In Touch