
This is probably unusual in that posts intended as a discussion about the stock market typically feature stock prices or market indices. Rather, I intend to use here only bond market prices and indications and still make interpretations about stock market risk.
My colleague Joe Calhoun has pegged stock investors as threading the needle – looking for data that is not too strong, since that would finish QE for certain. At the same time, data that is too weak indicates recession, meaning economic risk that isn’t yet “priced in.” In other words, more data that plays the muddle of “slow growth” with QE optimism and hope. I think that succinctly sums up recent action, even today as “stronger” data in the sentiment surveys offset the very weak housing estimates.
On the whole, I pay little attention to sentiment surveys like the Fed regionals except when they yield some unusual or outlier position. The major reason for that is that they don’t mean what most people think. But, as Joe rightly and persistently points out, stock market determinations are not about what I perceive of the economy, but rather what investors as a whole perceive. So his thesis, I think, remains valid, though amounts to a good deal of self-delusion (on investors’ part, not Joe).
I don’t think that is surprising at all since bubbles are full of rationalizations, the net of which is the diminishment of every form of risk in investor calculation. Eventually, however, that gets shaken and overtaken by events.
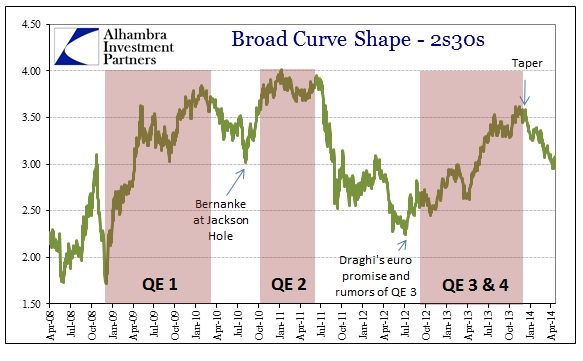
The bond market seems to be interrupting the fantasy. The major persistence of bond stasis notwithstanding, the flattening of the yield curve is quite telling. In the broad curve measure of the 2s30s, the behavior is almost too perfect not to notice – the flattening currently mimics exactly the behavior at the end of each of the prior QE programs. In other words, the bond market is fully and definitively pricing the end of “emergency” boosting (for the third time).
At exactly the same time, the rest of the treasury curve/complex is failing to find growth projections. The inflation breakevens continue to persist in their peculiar state of irrelevance. That cannot be anything other than a rejection of the “real recovery” narrative. Even the recent move in the 5-year inflation expectations has begun to recede, as it never really left the range into which it has been apparently captured.
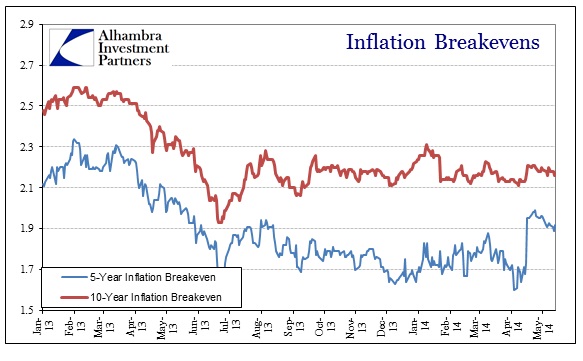
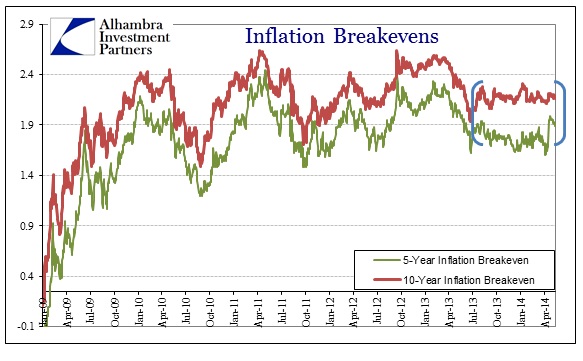
The stubbornness of the breakevens is made all the more compelling, in my opinion, as it occurred through both the curve steepening of last summer/fall and its unwinding. If anything, which recent history showed in prior episodes, breakevens should have widened (rising inflation projections) with the curve selling steeper. And before that, inflation expectations were falling against the grain of QE3 in full bloom.
For stock investors, that is the opposite of Joe’s narrative of stock investor expectations– the definitive end of QE, without the growth. It gets far more difficult to justify deeply imbalanced valuations without either. It would seem to be something far closer to the worst case for the bull marketeers. Of course, bond markets are both equally fallible and artificial given all the interference in prices and yields, but it makes for quite the contrast.
Click here to sign up for our free weekly e-newsletter.
“Wealth preservation and accumulation through thoughtful investing.”
For information on Alhambra Investment Partners’ money management services and global portfolio approach to capital preservation, contact us at: jhudak@4kb.d43.myftpupload.com
Stay In Touch