
Today’s employment release has been described, in numerous places, as “perfect.” I am hard-pressed to disagree, as the report itself contained absolutely everything an economist would want to show payroll strength (economic strength is another matter entirely). The Establishment Survey itself was overshadowed, though satisfying, by the Household Survey and especially a jump in the labor force.
By the numbers:
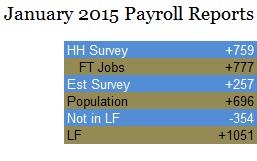
It was that latter that completed the run of perfection for January, as the calculated official labor force expanded by as astounding 1,051,000 people – in the same month that raw employment sees its greatest decline. The last time we saw anything even close to that was April 2010, when 668k thousand joined the job market at what was the nadir of the employment disaster (thus making sense). The only other months in the past thirty years with greater than 1 million were January 2000 and January 1990 (notice the pattern here).
The more these great figures stand out, especially for a January month, the more they attain statistical questions.
That starts, of course, with continued major revisions. While there were minor downward revisions going back to 2011 and 2012, most of the newly revised upward positivity took place starting somehow in July 2013.
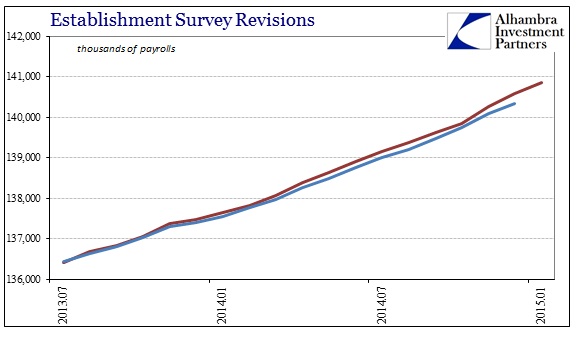
That was the period just after the massive, taper-threat bond selloff, followed by the government shutdown, the Polar Vortex and not to mention a major disruption in mortgage credit (refis mostly too) and the housing market. Yet, the BLS now suspects that none of that mattered to businesses as they not only hired at consistent rate throughout, they did so at a consistently higher rate now.
The bulk of the revisions, however, have been saved for the last few months. November’s terrific Establishment Survey has now been estimated toward the stratosphere. The BLS now says that payroll growth in November’s was +423k, the best month in a long, long time; even December, where wages and spending tapped out, was revised significantly upward to +329k.
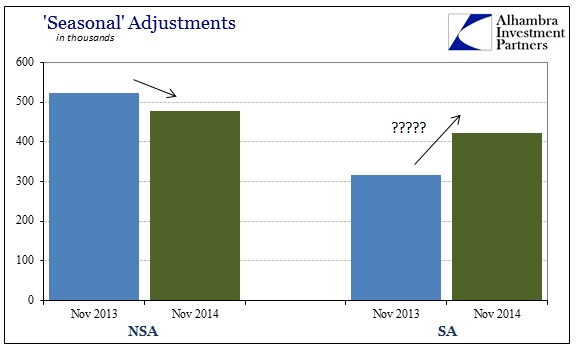
It is the November revisions, however, that don’t follow consistency. In the non-adjusted series, November 2013 gained 523k payrolls above October 2013, while November 2014 gained less from the prior month, only 478k. Yet, somehow, in the “seasonal” adjustments November 2014 is +423k to November 2013’s +317k (also revised). Now it is likely that the BLS is making a subjective assessment about October 2013, meaning that the government shutdown is being discounted somehow in comparing the increase in November 2013’s unadjusted series. In other words, the BLS is likely making a statement that the raw increase in November 2013 was affected by the “unusual” activity in October 2013, and thus the increase was not solely “organic” but a reversion that “allows” November 2014 to look better by the absence of such an adjustment last year.
Since we are introducing subjectivity into the “equation”, by inference at least, the numbers for January are equally surprising. And it hints at a stronger reference in the subjectivity of trend-cycle analysis.
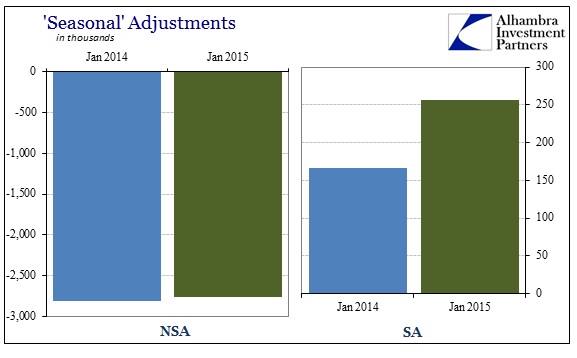
In January 2014, the economy saw its normal reduction in temporary work, as total payrolls fell by 2.811 million – this was the epicenter of the harsh winter, remember. By comparison, so far before more revisions you know are coming, January 2015’s reduction was 2.755 million. In other words, this year was better, but insignificantly so compared to the great and economically destructive Polar Vortex. Yet, somehow the adjusted figure in January 2014 was a very disappointing 166k, but January 2015 was a “reaffirming” 257k (it doesn’t get any more constant by looking at the prior January, either).
The BLS may be taking into account, through its ARIMA formulas, differences in holiday days or number of workdays related to that, but I say so what? Businesses are not going to hire differently because Christmas and New Year’s were on Thursdays this year, and thus “threw off” potentially December and maybe one weekend in January.
The feel of these numbers, especially the labor force, suggests a discontinuity perhaps pertaining to the annual population assessment. I don’t know that for sure, but for me the accumulations of all these are to cast doubts on the whole affair. As I have said before, anyone that believes in these figures as they are, or that they are even close to reality, is not going to be swayed by the possibility of interjections of BLS subjectivity. I think they should, but these numbers are often held as sacred economic status.
But even within the orthodox circles, there remains a wider problem with employment. Prior to 2008, the relationship between jobs and GDP was much closer and seemingly much more robust. Stated as Okun’s “Law”, there was thought to be a constant correlation as to how jobs produced spending, and thus GDP. Starting in 2010, a conundrum of sorts opened as the return of job growth just didn’t translate as it “should have” – so the recovery become something less of one, more closely resembling just forward movement absent further contractionary forces.
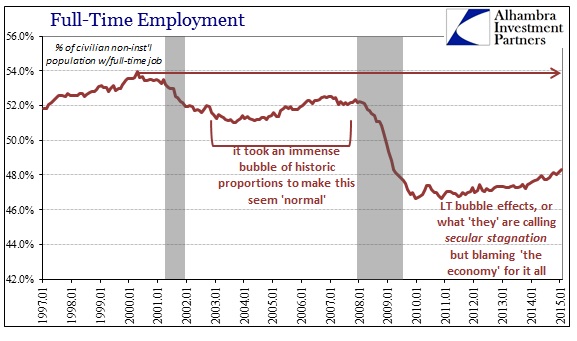
Part of that, as we can now plainly see, was the rendition of part-time work in place of full-time status, especially in those earlier days and years of the “recovery.” To that end, despite the huge jump in January 2015, full-time jobs are still short of November 2007’s peak by more than 1 million.
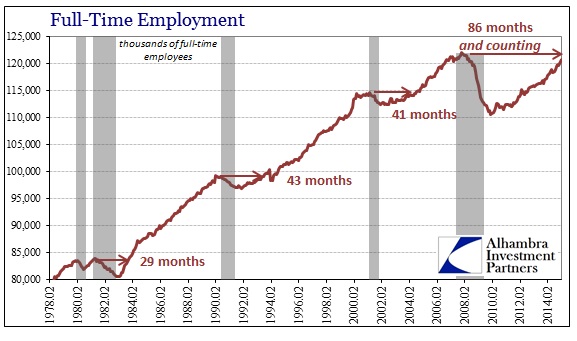
In fact, despite the gains, full-time employment is only marginally expanding above the population growth.
The result, in addition to some other factors, has been a breakdown in the assumed tight relationship between job growth, spending activity and thus the wider real economy; more precisely, a breakdown in the relationship between the Establishment Survey, PCE and thus GDP. This much is clear and remains so, which means that anyone who still believes in the Establishment Survey as payroll gospel, despite all its inconsistencies, still does not settle the larger economic question.
The comparison is historic:
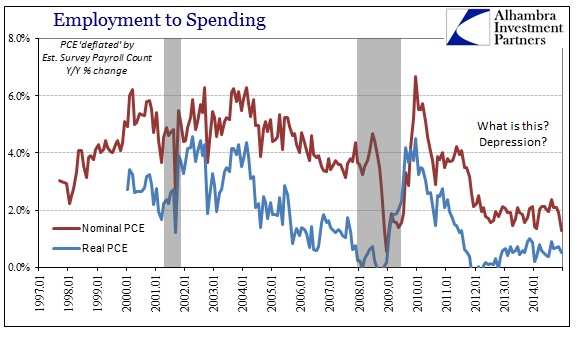
By taking personal consumption expenditures, which include a much broader set of economic transactions (including, unfortunately, imputations), and measuring them in the context of Establishment Survey job growth, it is immediately apparent the breakdown in Okun’s “Law.” Spending per job remains at a level consistent with both the Great Recession and the dot-com recession; in both nominal and real terms. And, as usual, that downshift dates to late 2011/early 2012.
What that means is that all this assumed job growth has had absolutely no economic impact apart from keeping the US economy out of obvious contraction while providing a statistical basis for those who have an interest in a more optimistic narrative about where everything is going.
Given that there are essentially two parts to this post, the accumulations of the first part, the statistical problems, to me reinforce the second part, the lack of transmission. For my analysis, I simply don’t believe those jobs exist outside of the BLS spreadsheets; if they did China would not be desperate toward “reform”, with Brazil on the brink of disaster.
However, you can still disagree with me about the first part and the economy is no better off as shown by the second. Maybe those jobs do exist, but they are nothing like what the US economy has experienced under past conditions. That is as much a structural issue, potentially, as cyclical, to the point of overriding any cyclical considerations as almost trivial. That is the legacy of what is undoubtedly, to me, a smaller economy in 2015 even when compared to the artificial 1990’s.
It is a tangled mess of statistics that don’t fit the age we live in. Maybe it would be easier just to grab hold of the proclaimed cheerfulness of the dollar, but instead I blame the “dollar.”
Stay In Touch