
The price of WTI index crude has fallen back below $50 again as inventories rise far more than expected. That has been the theme of late despite the recent retracement in crude. However, looking at WTI via the futures curve, trading habits are increasingly locking in the outer years (especially past 2016) around $65 – $70 per barrel. That is not an especially robust expectation for renewed demand a few years down the road after so much “weak” marginal supply is expected to be forcefully removed by cost structure.
The curve behavior, then, tends to waggle on various considerations of more likely demand than supply (which has proven resilient to this point). I find no coincidence in the recent rise in oil above $50, however relatively brief, timed the same as minor credit “relief” about the state of the world in early February (and especially that the Greek election didn’t bring everything crashing down).
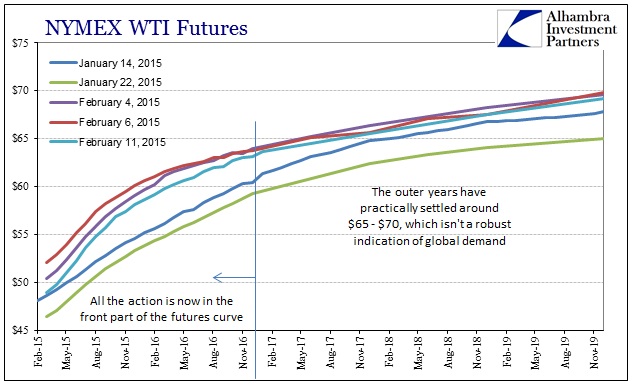
So it is odd, slightly, that the entire contango calculation out to the end of 2016 is almost entirely dependent on the front month or spot price. Again, to me, that suggests a high degree of uncertainty about right now and the rest of 2015.

I think a great deal of that uncertainty is that this “supply problem” looks less and less like one, and more and more one of varying demand. In fact, actual supply, especially from US sources, keeps coming in very much in line with expectations – it is inventories that have been so far out of forecast ranges.
The EIA expects U.S. oil production in 2015 to be 9.3 million barrels per day, slightly lower than the 9.31 million bpd forecast in last month’s short-term energy outlook.

In raw price mechanics, it is no wonder there is great difficulty in finding a “good” clearing price for the stuff. A lot of even foreign excess is going to find its way to the United States because of the huge amount of storage capacity that exists domestically. That would suggest that the contango market pressure is acting like it should, but that again there isn’t much appetite for future buying in 2015 or 2016 (and really not much in 2017 and beyond, but at least at a more stable price; for now).
This should not be “unexpected” unless you consider the global economy running closer to full recovery than the precipice of global calamity. But the historical record on crude oil is remarkably clear, especially the past quarter century years after oil prices settled in the 1980’s at the end of the Great Inflation.
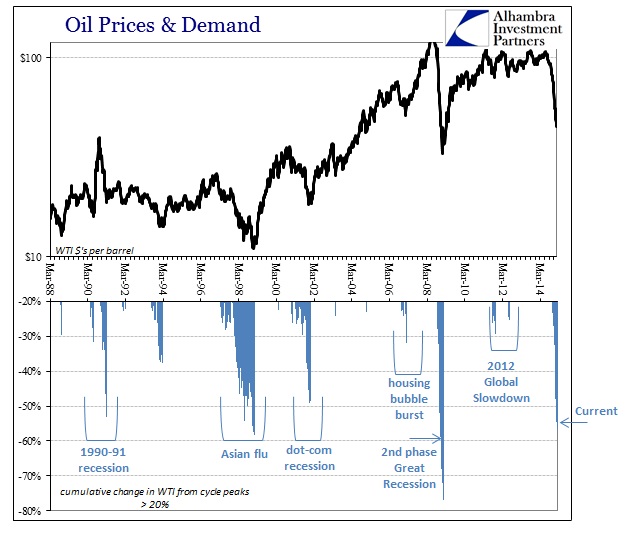
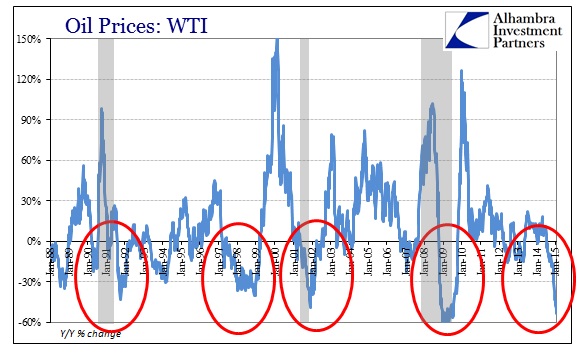
This most recent collapse places this oil market in the same class as only the second (and worst) phase of the Great Recession and Asian flu, “besting” the declines in both the dot-com and 1990-91 recessions. In each of those instances, oil “experts” were quick to produce the supply excuse as there was “no possible way” that the global economy was sinking – and sinking so quickly. No matter how you measure it, a price movement of this magnitude is equivalent only to the worst of times, which makes far more sense given the artificiality driving any positivity.
But as much as commentary remains fixated on oil, this downbeat assessment is actually very broad in its scope and already deep in scale. Not the least of which is the credit markets here in the US, recognizing the dangers inherent in the financial instability of the “strong dollar.” I have yet to see anyone comment on the “supply problem” of oil while recognizing that the US treasury market largely trades in tandem; thus precluding the idea of a “supply problem” to begin with.

In the end, however, it really doesn’t matter which commodity price you use as a proxy for actual economic demand. Pretty much every single basic commodity has experienced declines and absolute price levels that compare only to the Great Recession, including and especially copper.

And what has likely kept some of this “demand” uncertainty at play in the WTI curve, commodity prices across the whole range of economically sensitive components fell much further especially in December and January. It would be hard to blame the US shale “miracle” for such a dramatic slide in industrial materials prices.
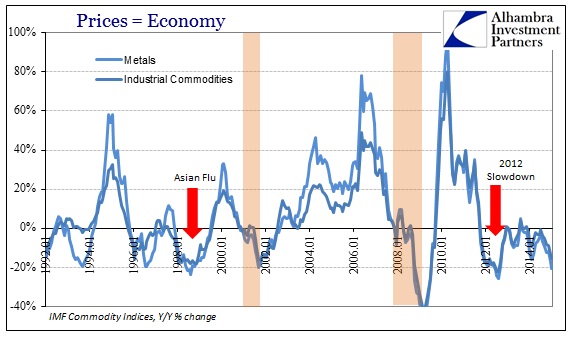
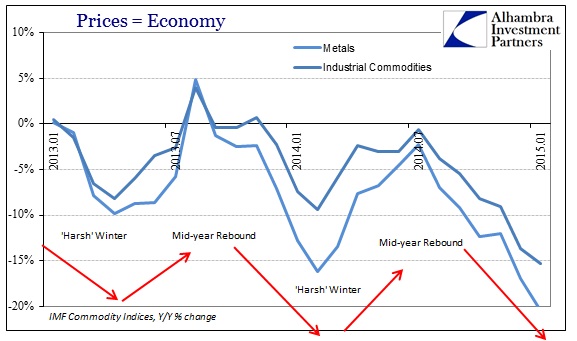
In fact, the year-over-year change in metals and industrials is as severe as the worst part of the 2012 slowdown – an economic feature of nothing but dragging demand so dangerous that it unleashed “unconventional” and “unlimited” central bank measures all over the world, including the US with QE3 and QE4. This pace of price declines is on par with the dot-com recession, the Asian flu and the 1990-91 recession.

In simple nominal terms, these commodities beyond crude are now back to levels last seen during the collapse phase of the Great Recession. So much for the trillions in currency units “expended” to maintain some positive force of “inflation” or even “inflation expectations.” With commodity prices reflective of physical clearing, you cannot fake actual economic activity here, and it is no coincidence that prices have been falling, more slowly at first, since the big slowdown in 2012. Again, that this occurs over a broad spectrum of commodities is not a good sign for global demand, especially given the acceleration (deceleration of price) of clearing problems just in the past few months.

In other words, this has been a demand problem since 2012 (and really since the housing channel of global monetarism died in 2006) that is getting worse by the month (or the week, if you prefer the US EIA inventory figures). That is negative for not just the price of oil, but anyone who thinks the global economy, with the US an inseparable part of it, is still heading in the “right” direction.
Stay In Touch