
There was no third consecutive quarterly liquidity event on April 15, but I think there was an observation of the same systemic crack that just didn’t, this time, go anywhere. I have been highlighting repo rates particularly during April where GC rates failed to reset as they had done after every other quarterly window dressing. This time was already notable as the quarter-end surge in GC was completely out of line with anything else really going back to 2009, which raised suspicion to begin with. That repo rates lingered in an elevated position suggested either that regular, systemic problem or a hint at an entirely new repo regime perhaps related to a resetting of interbank hierarchy in anticipation to and of the end of ZIRP.
As of this week, repo rates finally relented which all but rules out that latter hypothesis. Further, repo rates peaked right on April 15 and slowly converged from that day, which I believe shows that same regular systemic, quarterly deficiency.
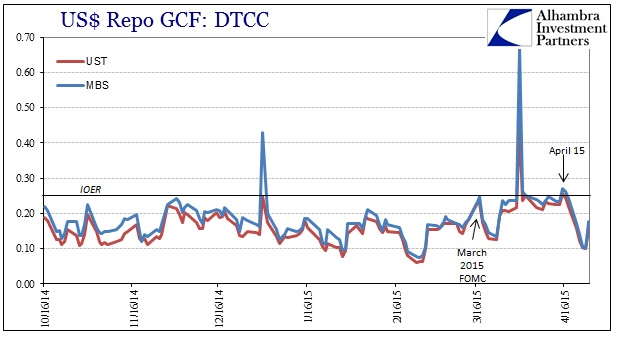
The obvious question to ask is why, then, did this liquidity absence not lead to a rerun of October or January 15? The answer relates to the fact that liquidity by itself does not set pricing regimes or even entertain much effect singularly. In other words, liquidity is the ability of the system to maintain orderly pricing regimes, and its deficiency combined with an inflection or serious shift in selling or buying pressure is what turns out into large asset price swings. I think it safe to assume that the FOMC repositioning, which seems very much how these “markets” have taken it, on March 18 removed or deflected any building selling (general assets) or buying (UST market) pressures. Thus, the April 15’ weakness wasn’t exploited, so to speak, by wider and more general market forces.
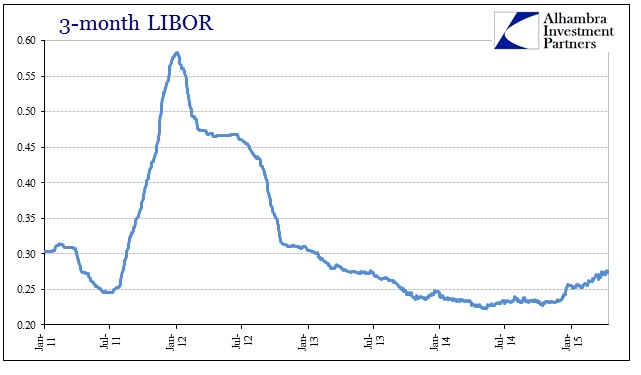
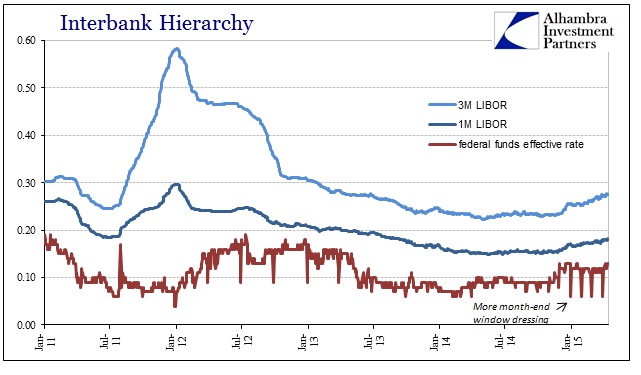
I think that is significant in and of itself, but there are still wider questions about the state of wholesale interbank exchange. While I say that we can rule out policy positions in the repo end of liquidity, there are other indications where that may not be so black and white. For instance, LIBOR rates have been rising rather steadily across the calendar in much the same pattern and turns.
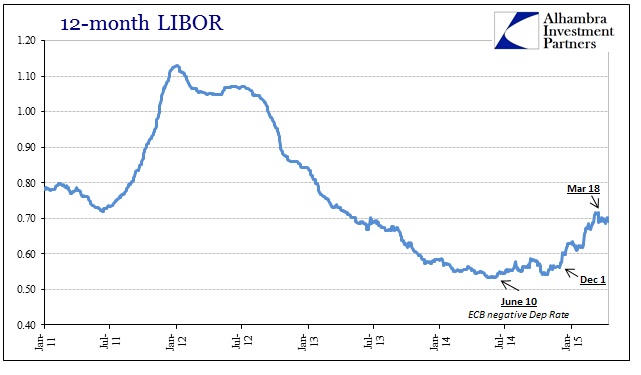
The LIBOR curve has grown steeper which, as opposite a further maturity, general yield curve, is not necessarily a positive indication (certainly wasn’t in 2011-12). The interbank markets tend to “want” to be more stable, and thus heterogeneous shifts may be an indication of attaining more stress or a negatively changing dynamic. One way to check is to try to decompose these rates into various risk components via isolated spreads.
The TED spread is a measure of credit risk, as it is derived from the difference (typically) between 3-month LIBOR and a 3-month US treasury bill. Since the bill is risk-free and LIBOR is unsecured interbank, both at the same maturity, it has segregated a credit component of money market views on that risk.
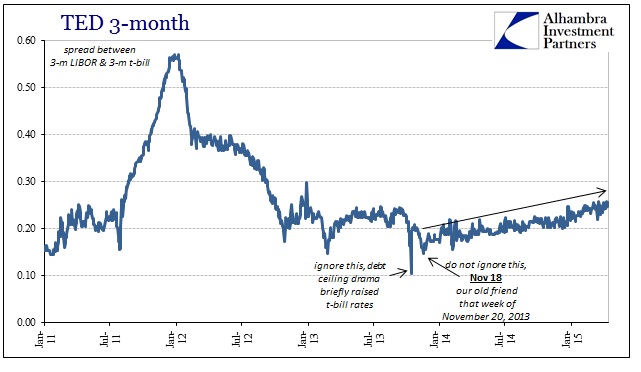
The TED spread has been rising rather steadily since, no coincidence, the week of November 20, 2013! There was even a slight elevation around December 1, 2014, both of these points matching up very closely to significant market outcomes. It seems, post-taper, as if liquidity markets are taking, slowly, more risk consciousness about credit positions even if more general asset prices do not appear to be. One instance, however, that I highlighted earlier this week would seem to agree with that shift, and the general area of its timing: junk debt.
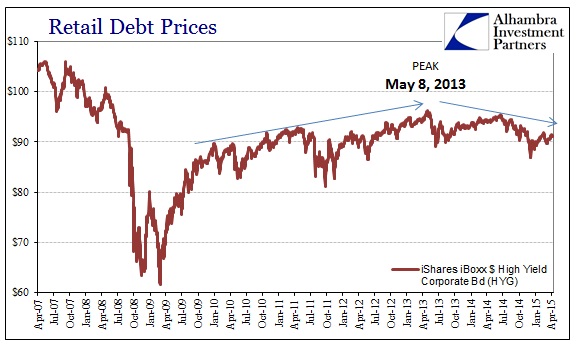
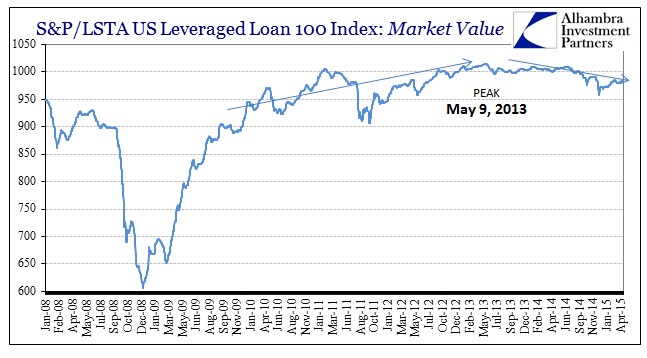
These are, admittedly, more subtle changes but under ZIRP/QE such may be seriously magnified by the heightened state of repression. What may seem very small outwardly could be having profound impacts especially within the tightened quarters of interbank hierarchy. A general and growing increase in credit risk perceptions might begin to explain some of the liquidity irregularities that seem far less irregular these days.
I would also add time value to that sentiment, as the maturity spread between various LIBOR tenors has also heightened more recently. As you can plainly see in the LIBOR rates shown further up this post, both 3- and 12-month LIBOR are rising, but the 12-month is doing so much more rapidly. Again, unlike a bond yield curve, such “steepening” is as much an indication of potential instability.
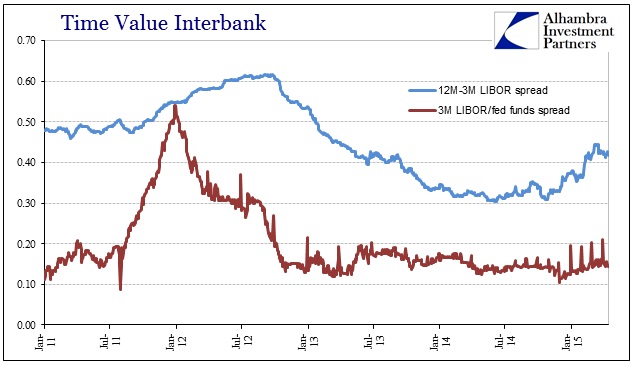
As with 2011-12, the rising 12M-3M LIBOR spread presaged greater economic difficulty as a transmission off of short-term illiquidity and general disfavoring of risk (shown by the 3M LIBOR/federal funds spread). In this case, as opposed, as it turns out to the 2007-08 panic, banks signaled their risk aversion by being far less willing to fund in longer terms, especially up to 12-months. While there is clearly no companion signal in 3-month LIBOR to federal funds this time, the further maturity spreads for LIBOR suggest at least the same disinclinations.
What are missing from this analysis are OIS figures. The Overnight Index Swap rate gives us some insight into how money market participants view policy and policy transmission as it relates to setting these other “money” curves. I won’t get into details about that here, saving a more detailed look at OIS for next week, but I will say that indications are in OIS that the increase in LIBOR rates tend to confirm an exogenous risk aversion (from the point of view of specific changes in monetary policy; the “liftoff” of the federal funds target).
I would also add one more point, bringing this back to the calendar cracks in systemic liquidity. If you look at the effective federal funds rate just in 2015, note the much higher volatility as well as the pronounced month-end “dumping” that coincides with all the rest of this.
All of these facets can be expressed and internalized as greater volatility in money markets working out an in-process repositioning of risk perceptions. The introduction of taper in the middle of 2013 seems to have had a massive and lasting impact on money markets, an idea that has been documented in other forms over and over. None of this is conclusive however, but it does tend to suggest that there is very real weakness in liquidity that is not tied directly to what the FOMC does meeting to meeting, but is tied directly to how differences in “forward guidance” (the Bernanke version) might be steering systemic function.
Skipping all the verbosity, it looks as if the road ahead is quite rocky; whether or not the FOMC decides to be “dovish” or “hawkish” may be quite beside the point as it is already playing out.
Stay In Touch