
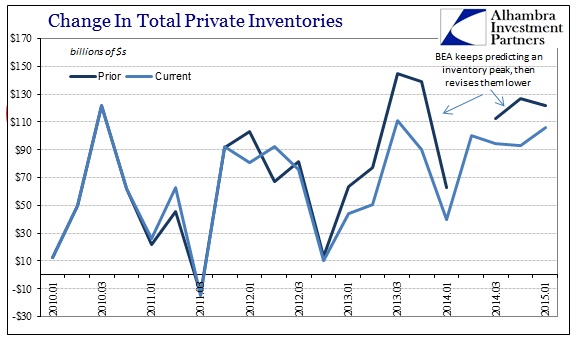
Revisions to Q1 GDP were actually a little better than expected, as the new estimates show a -0.7% drop instead of what might have been as bad as -1.5% (with one more “regular” revision to come). Record inventory remained a record, revised from $122 billion to merely $106 billion, but PCE growth came down to just 1.8% – a far cry from the 4%+ that was being advertised as the durable recovery backbone only a few months ago.
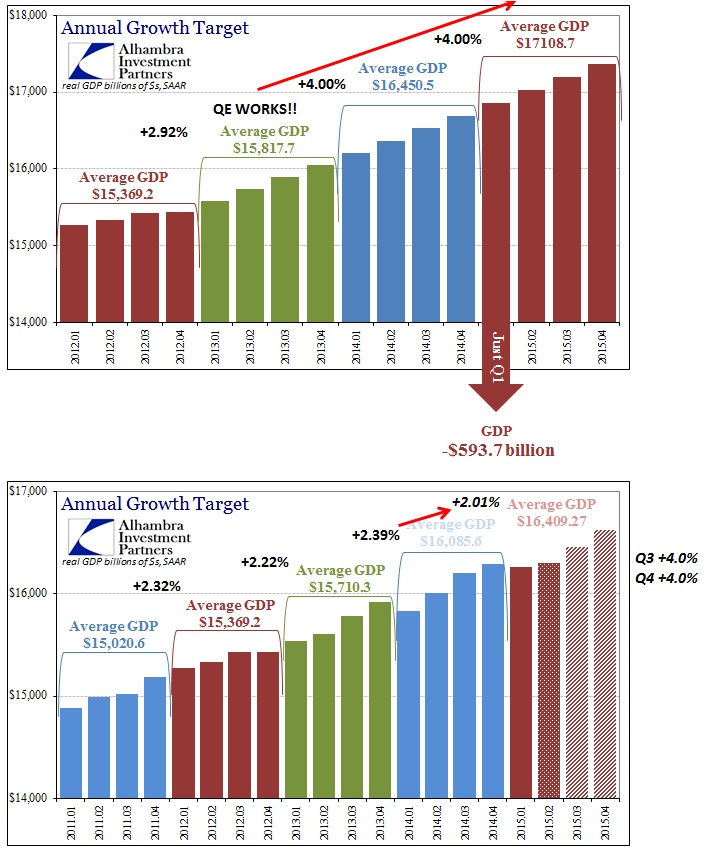
While the Fed may look to seasonal problems in Q1, Q2 is already estimated at just 0.8% meaning that given the figures we have now there would be no, zero, growth for the entire first half of 2015. The current track, for real GDP, is $16,294.7 billion in Q4 2014, $16,261.4 in Q1 2015, and just $16,296.5 for Q2 2017. While that works out slightly higher comparing Q2 ’15 to Q4 ’14 it actually calculates to a small contraction for the entire 6-month period, making it difficult to simply assert without evidence that everything is still grand.
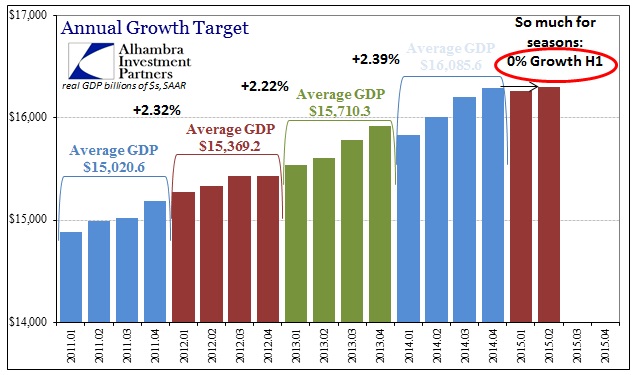
Worse, in order for 2015 GDP to just match last year’s paltry 2.39% will require better than 6% growth for all of H2.
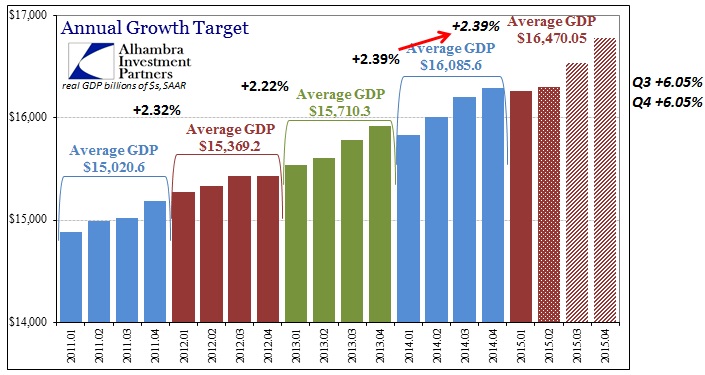
Just to preserve a minimal 2% annual growth rate will require 4% in H2. The economy performed that miracle last year but there is a vast difference this year with almost everything, including now GDP, suggesting a much deeper and wider economic hole.

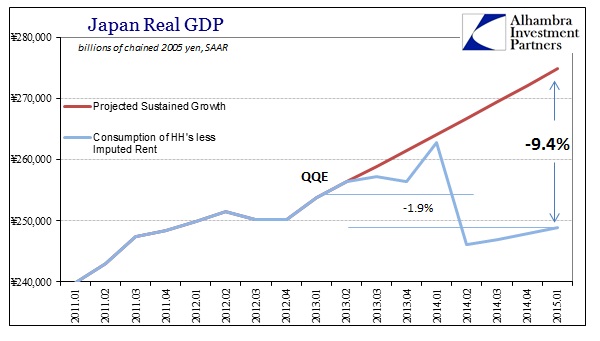
In reality, that hole is not just unstable and perhaps contracting GDP, it is the overall insufficient trend. Like Japan, the focus on quarterly figures alone (and worse, monthly) is misleading; often intentionally so. Cyclical stability is certainly a focus, but every year since 2007 this economy moves further and further away from where it rightfully “should” be given even recent past history.
We can begin to appreciate that, the lost opportunity of compounding, just in assuming QE3 and QE4 actually worked somewhat well. Instead of the uneven gains that were “achieved” we assume that the latter QE’s pushed economic growth to a steady 4% – not great by historical standards but something that would be actually celebrated in this day and age. The lost economy is simply massive.
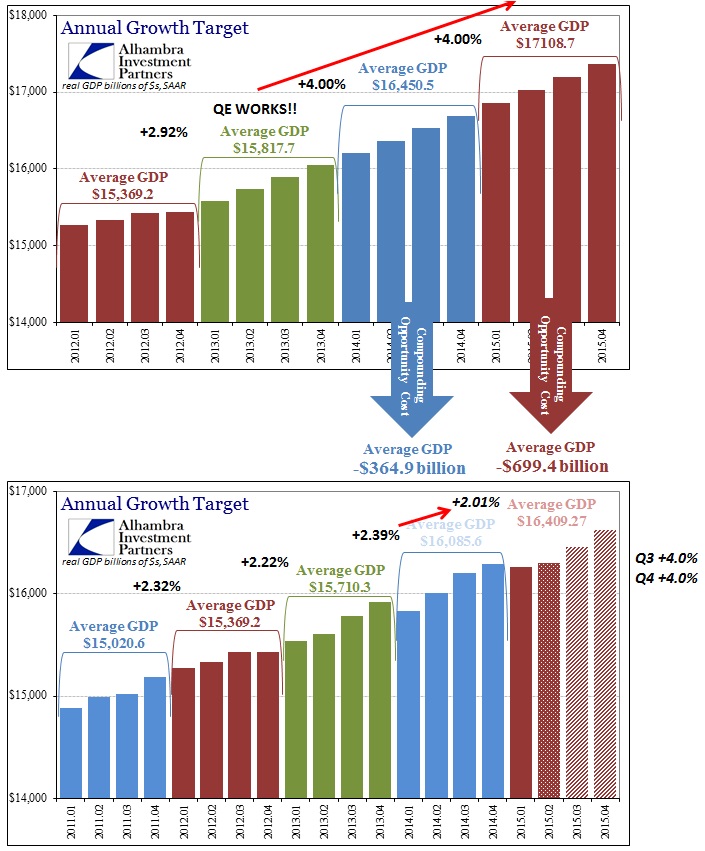
The difference in 2014 would be more than $350 billion – which, adjusted for scale, would be about the size of the 1982 double dip recession. The difference in 2015, assuming a decent H2, would be $700 billion! That is of the scale of the Great Recession itself, top to bottom. Spread out across an entire year it stands as something like a depression, but doesn’t get counted in that way because the more recent direction, at least here and there, is up.
In just Q1 2015 alone, the difference is almost $600 billion. That is just assuming the last QE’s actually performed as the public was assured, over and over, they would; with opportunity cost only dating back to the start of 2013.
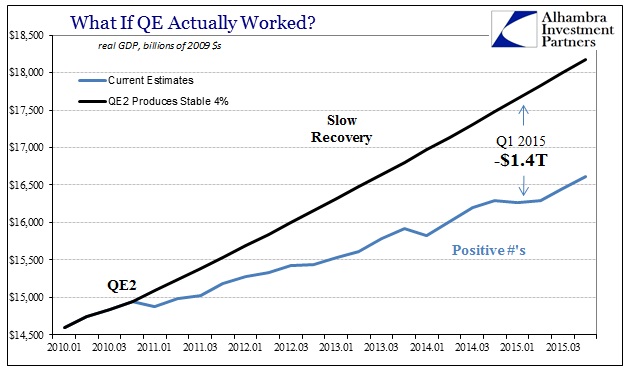
Going back and assuming QE2 actually worked leaves behind all ability to comprehend the scale of this disaster. In Q1 2015 alone, the difference is $1.4 trillion.
All monetary and orthodox theory has been forced to reckon with this, but the most they can assume is that there is something wrong with the economy itself rather than the theory. That draws back upon rational expectations as a mathematical foundation. In terms of actual observation, there seems to be far too many similarities among economic systems that have been high practitioners of QE for it to be a dependent variable. In other words, what is common besides the lack of recovery and meeting stated standards is the implementation of QE itself.
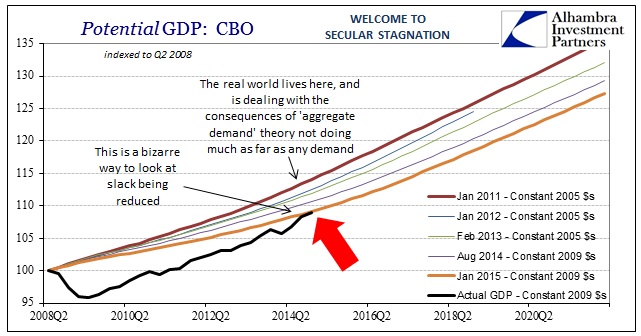
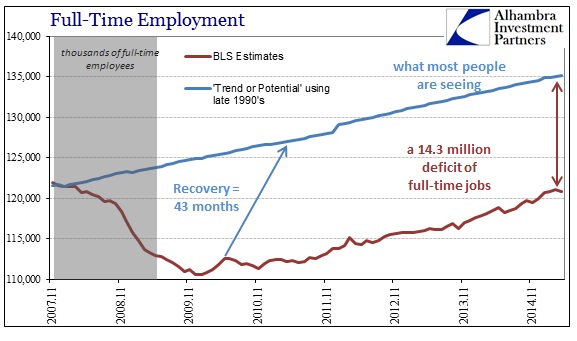
Any unbiased comparison here would see that for what it suggests, that not only does QE not work it is likely a negative factor holding any (every) economy back. The projected trend shown above, at only a decent rate of 4%, was actually what was expected by nearly all economists and policymakers (as they themselves calculated in their “potential” estimates; shown below). If you fervently expect one thing to happen, and then do a great deal about what you think might make it happen, when it fails to happen at all don’t you at least look at what you did as a primary suspect?
Not if you’re an economist.
And so we can begin to calculate the costs of undergoing QE from the work economists have already done to hide its failure. The CBO and other orthodox interpretations are looking at these and subscribing to “secular stagnation” when in fact, as the common factor with Japan proves, it is not secular at all – it is QE stagnation. That fact that the economy has failed any standard for recovery and still, to the point of at least a half-year contraction now, is so highly unstable despite trillions in monetary intrusiveness does not suggest that current GDP activity is the “correct” market-clearing level of activity under rational expectations. Instead, common sense dictates that rational expectations has it all wrong and that artificial prices do actually interrupt and forestall organic trends that should, and always have, formed in and around their own self-contained rebound inertia.
The fact that GDP is worse in 2015 already makes the employment numbers from 2014 that much more suspect. In the big picture, however, that is actually a small matter. There is enough time history here in the data series which moves these trends out of possible randomness and into the realm of some unifying factor. A great many economists have begun to even admit as much, but their solution is to blame a further unspecified economic leak when the most obvious answer is right there for all to see – here and everywhere else.
It is time to revisit then-Treasury Secretary Tim Geithner’s warm welcome to the recovery summer, all the way back in August 2010:
THE devastation wrought by the great recession is still all too real for millions of Americans who lost their jobs, businesses and homes. The scars of the crisis are fresh, and every new economic report brings another wave of anxiety. That uncertainty is understandable, but a review of recent data on the American economy shows that we are on a path back to growth.
The recession that began in late 2007 was extraordinarily severe, but the actions we took at its height to stimulate the economy helped arrest the freefall, preventing an even deeper collapse and putting the economy on the road to recovery…
The economic rescue package that President Obama put in place was essential to turning the economy around. The combined effect of government actions taken over the past two years — the stimulus package, the stress tests and recapitalization of the banks, the restructuring of the American car industry and the many steps taken by the Federal Reserve — were extremely effective in stopping the freefall and restarting the economy.
Those all came after the end of the freefall and it is increasingly dubious as to any positive impact especially over the five years since he wrote those words. With Japan now having fallen into almost the exact same pattern, the emphasis needs to shift from what more can authorities do to what dismal ends have they wrought.
Stay In Touch