
The Chinese Manufacturing PMI spent most of the past four and a half years straddling just the good side of 50. In fact, it hasn’t been above 52 since early 2012 – a quite remarkable feat of low variation. This fruitlessness is somewhat emblematic of China’s dilemma; no matter what they do the industrial and manufacturing sector will not catch fire. And that may be the best that can be said of the monetary and fiscal “stimulus” since that time, for at least the bedrock of China’s economy was maintained in something like zombification for so long. Of course, it took great cost in bubble and debt terms to accomplish so little, but I am trying to be charitable.
The difference in the PMI isn’t really that it might be below 50 but rather that it lingers and has remained below 50. That trend, which is all that PMI’s might be able to suggest, starting in 2015 but really the second half is what is important.
China’s factory activity skidded to a three-year low point in January, adding to further gloom about the state of the world’s second-largest economy.
The government-compiled January manufacturing purchasing manager’s index (PMI) came in at 49.4, slightly missing Reuters consensus estimates for a 49.6 reading and ticking down from December’s 49.7 figure. It was the weakest result since 2012 and marked the sixth straight month in contraction territory.
The mood was worsened by a private survey by Caixin and Markit that showed January manufacturing activity shrinking for the eleventh straight month. Caixin’s survey, which tracks smaller firms than the official indicator, came in at 48.4, compared to December’s reading of 48.2.
In these kinds of data points, recessions show as not the absolute changes but how long those changes remain in place. For a PMI to stick below 50 for eleven or six straight months (in the case of the NBS “official” PMI) only suggests that there are recessionary tendencies already at work. It is the duty of a broad survey of indications to find corroboration, which in China is no difficult task.
While mainstream commentary has tried to diminish the relevance and marginal importance of manufacturing, the clear trends in non-manufacturing show that hope to be plainly false. As noted last week, China appears to be transitioning to a consumer or services economy only because the decline there follows with some lag the levels of activity in industry. Again, China’s manufacturing and industry remains the economic baseline; all other differences can be attributed to time. The non-manufacturing PMI in China shows that relationship clearly:
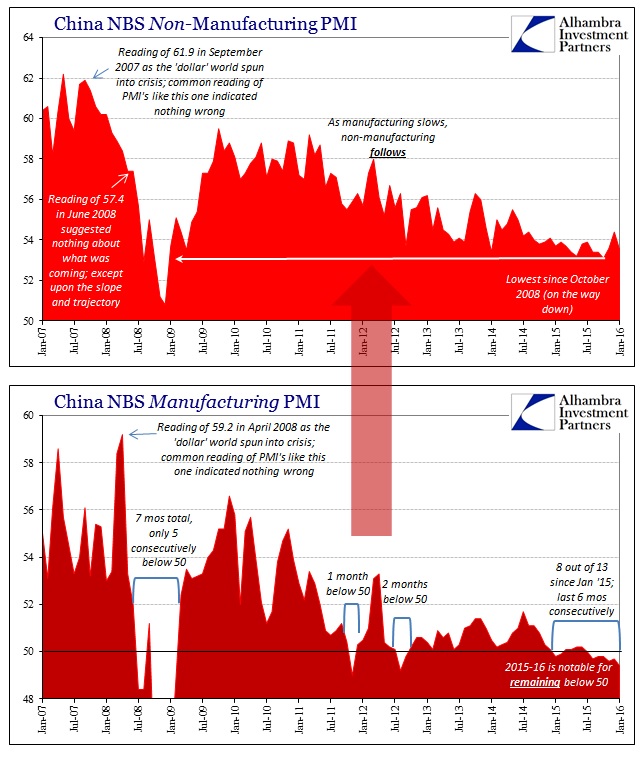
After bouncing to 54.4 in December, the highest level since August 2014, the non-manufacturing PMI in January failed to match all mainstream expectations of that being the beginning of the long-expected end to the downtrend. Instead, the reading fell back to 53.5, which is the same low level that dominated since April last year. In other words, the December rebound was the same kind of individual monthly variation that excites economists but briefly before the dominant trend is re-emphasized (such as the one-month jump to 55.5 in April 2014; or the reading of 56.3 in October 2013). PMI’s are useful only in broader context. For China on both sides of manufacturing and not, the broader arrow of the economy remains pointing downward.
That direction and lingering also applies to US manufacturing. While the Federal Reserve’s Industrial Production estimates already suggest recession on their own, that is further corroborated by the ISM Manufacturing PMI. The ISM is given enormous respect in terms of even mainstream economic interpretation since it dates back to 1948 and renders usually limited false positives. The Index for January moved up slightly but only due to December’s downward revision. In any case, it remained below 50 for the fourth consecutive month (as October was also revised down from 50.1 to 49.4).
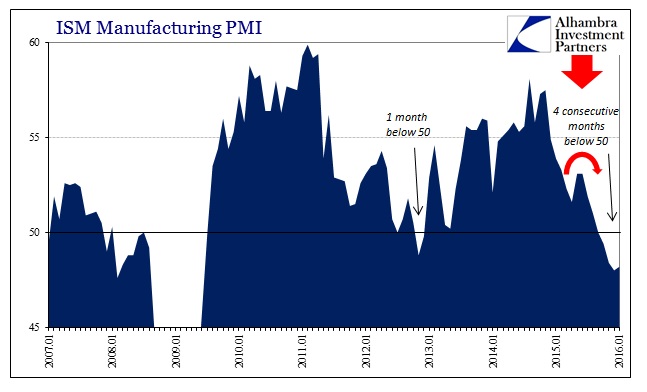
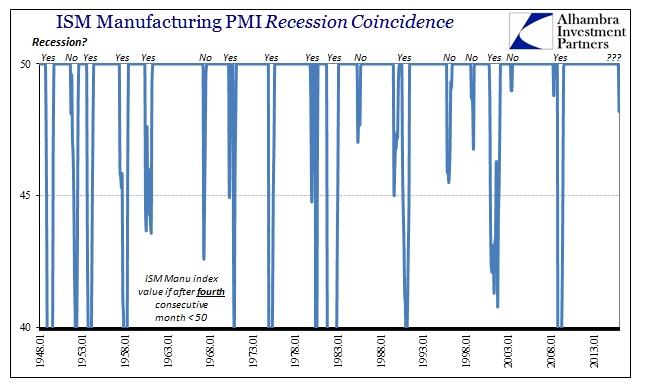
There are more false positives for recession with the ISM alone even at four consecutive months below 50, but again we use the index in conjunction with other indications to arrive at a more textured clarification. The ISM itself suggests nothing other than broad-based and sustained weakness, while indications like wholesale and manufacturing sales (and inventory) along with IP fill out the broader paradigm.
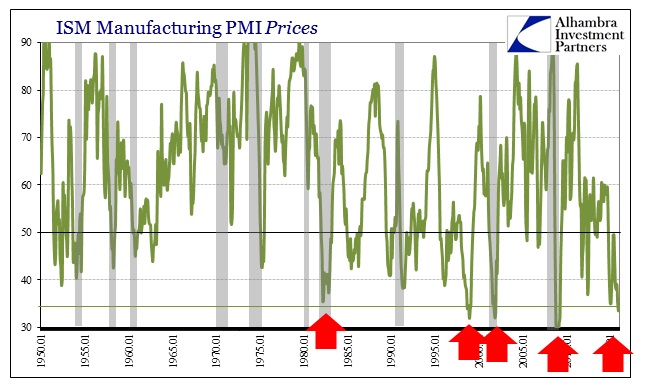
In that respect, some of the sub-indices of the ISM suite likewise suggest heavy and sustained economic weakness not limited to a narrow cross section of the domestic economy. The Prices Paid component, for example, remained at 33.5 in January and thus an extremely low level that reflects the commodity price collapse as it enters the real economy of manufacturing business.
Altogether, both China and US manufacturing, there was/is clearly something different about 2015 and now 2016 that is separate from the insufficient and decrepit recovery as it existed before then. In other words, if like China’s PMI there was at least some zombified growth (positive #’s) up until 2015 then that is no longer the case leaving only the suggestions of both a global recession and the common denominator for both sides of the Pacific – US consumers.
There is no doubt as to economic weakness anymore; what is left unresolved at the moment is exactly how much. In terms of future projection, however, there is less debate as the “arrow” continues to suggest downward in a spreading format; geography as well as across a greater proportion of the interior of the global/domestic economy. Even economists are starting to worry, a lagging indication all its own.
Stay In Touch