
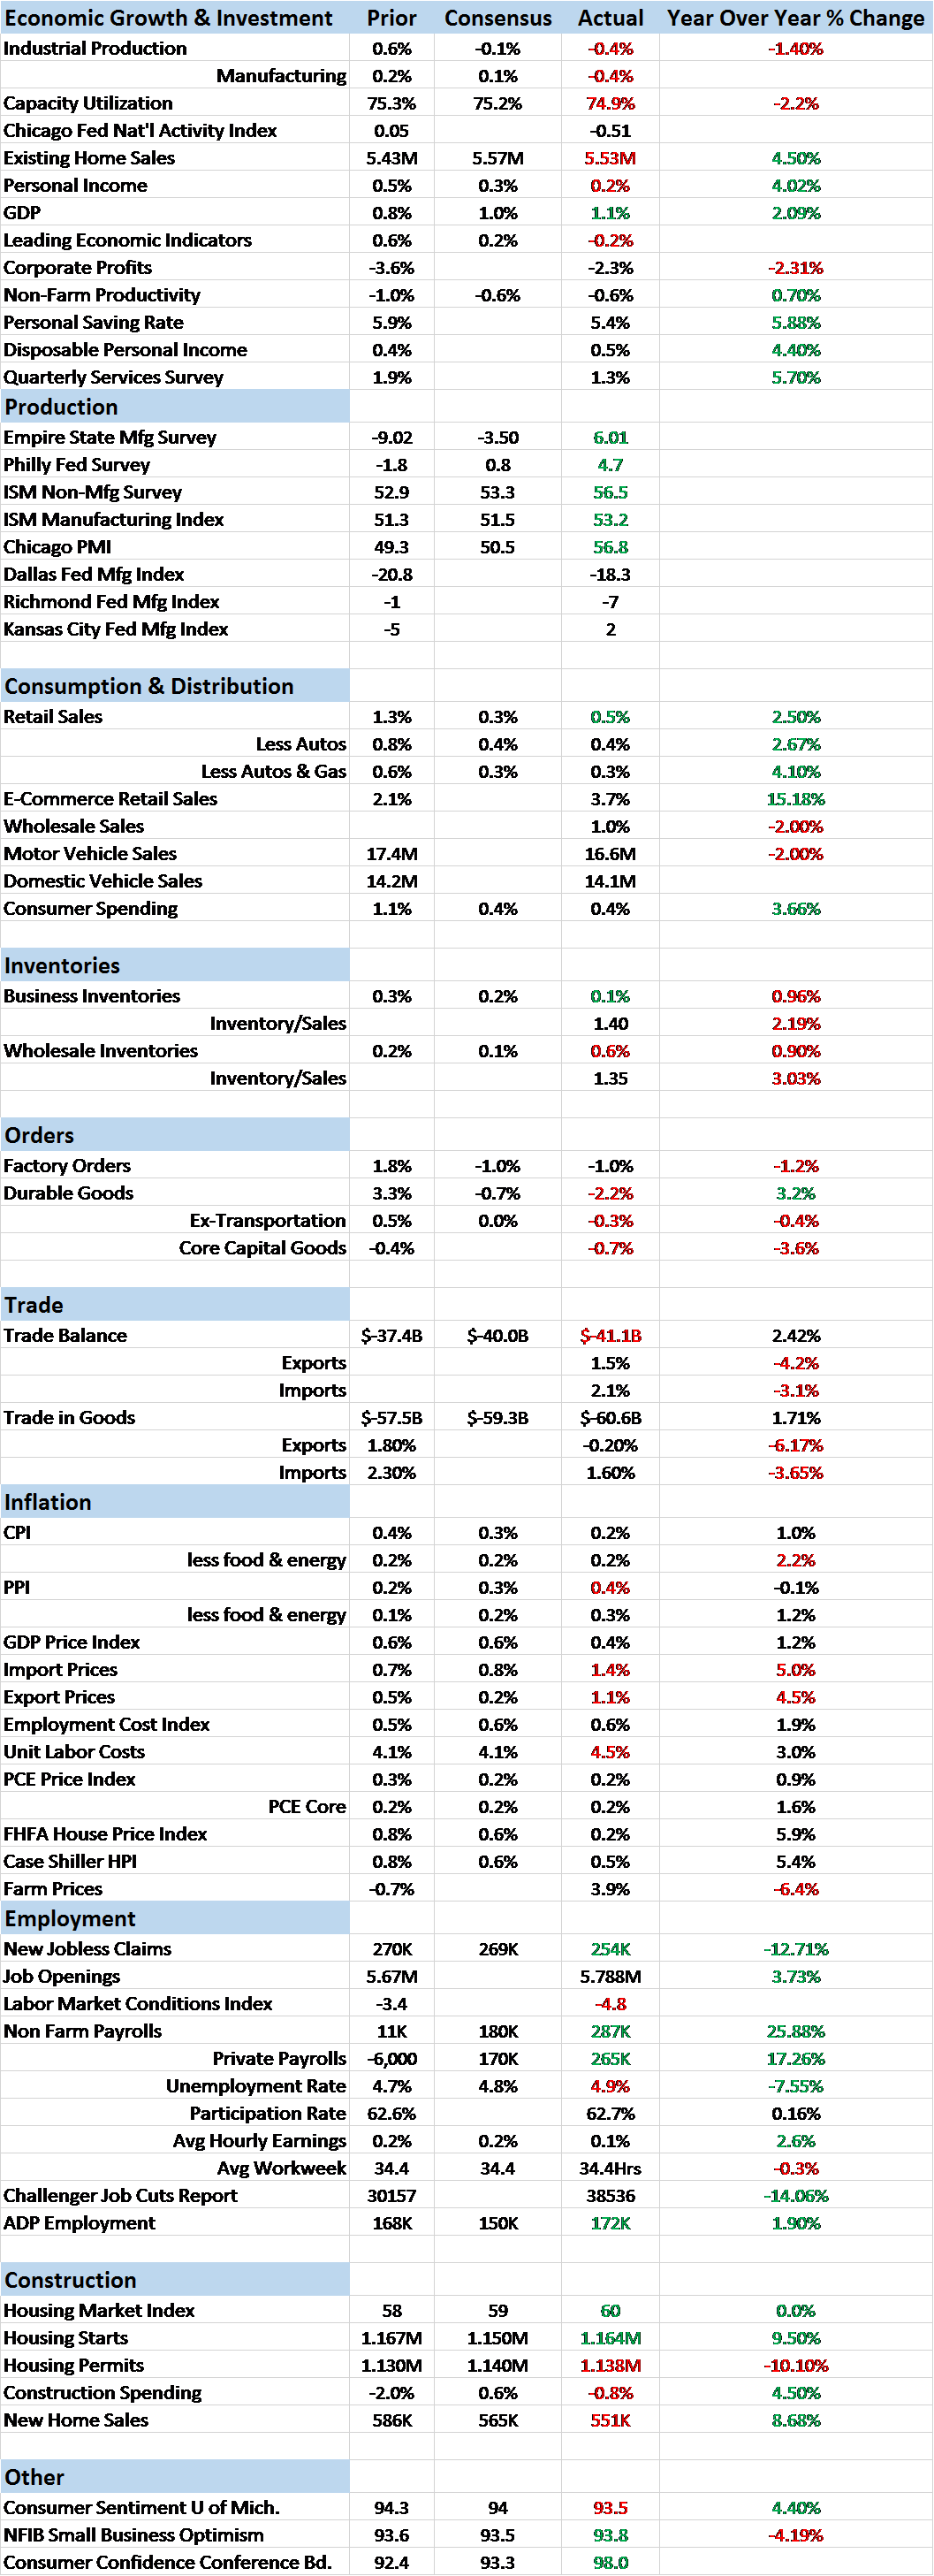
Economic Reports Scorecard
The response to the much better than expected employment report today is quite interesting although not in a good way. Stocks will surely get most of the attention, assuming they continue to trade higher by the end of the day (they did), but other markets – bonds and gold – are not confirming the strength of the report. I don’t know when the divergence between bonds, stocks, gold and commodities will be resolved but it would seem that at some point it must. There are so many cross currents at this point – Brexit and the rest of the European problems, a US election in less than six months with nary a decent candidate in sight, central bank interventions, negative interest rates and QE, China slowing, Japan being Japan – that the confidence level in any forecast must be near zero. We know the Fed is bad at forecasting and now because the world’s central banks are so active I am starting to doubt the forecasting ability of the market itself.
Notice I said the response was interesting not the report. The report itself not so much; it has to be taken in context. It is only one month and the trend this year has been down. The monthly average for the second quarter was 147,300 versus 195,700 in a very weak Q1. And that was down from the previous year. There were some interesting tidbits: those working part time for economic reasons dropped considerably to name just one. So, yes it was good but in the big picture, one month amounts to so much noise. For a more complete view of the big picture employment situation, read Jeff Snider’s take here.
The other data released since the last update was again fairly weak with a few strong reports sprinkled in – although most of those were survey based, anecdotal type reports. So we got a weak personal income and spending report – hard data or as hard as it gets with this stuff – offset by a rebound in the manufacturing ISM, a survey of purchasing managers. We have a big jump in the Chicago PMI offset by a surprisingly weak construction spending report. We get a rebound in the non-manufacturing ISM after a weak factory orders report. We get auto sales down 4.5% and the aforementioned employment report. When we look at things overall, not much has changed. The US economy continues to weaken – slowly – but is not in recession – yet.
The result is a contradictory mess in markets with stocks and bonds both making or nearing all time highs. We get a flattening yield curve but narrowing credit spreads (at least over the short term). We get a dollar that is flat for the last 14 months but gold up 25% just since the beginning of the year. And despite weak global growth we get the general commodity indexes up about 25% from the lows. If you are looking for clear guidance on the economy, this isn’t it.
The rally in bonds is not, by the way, about inflation expectations. 5 year, 5 year forwards, an indication of inflation expectations derived from the TIPS market, shows inflation expectations today the same as they were in February.
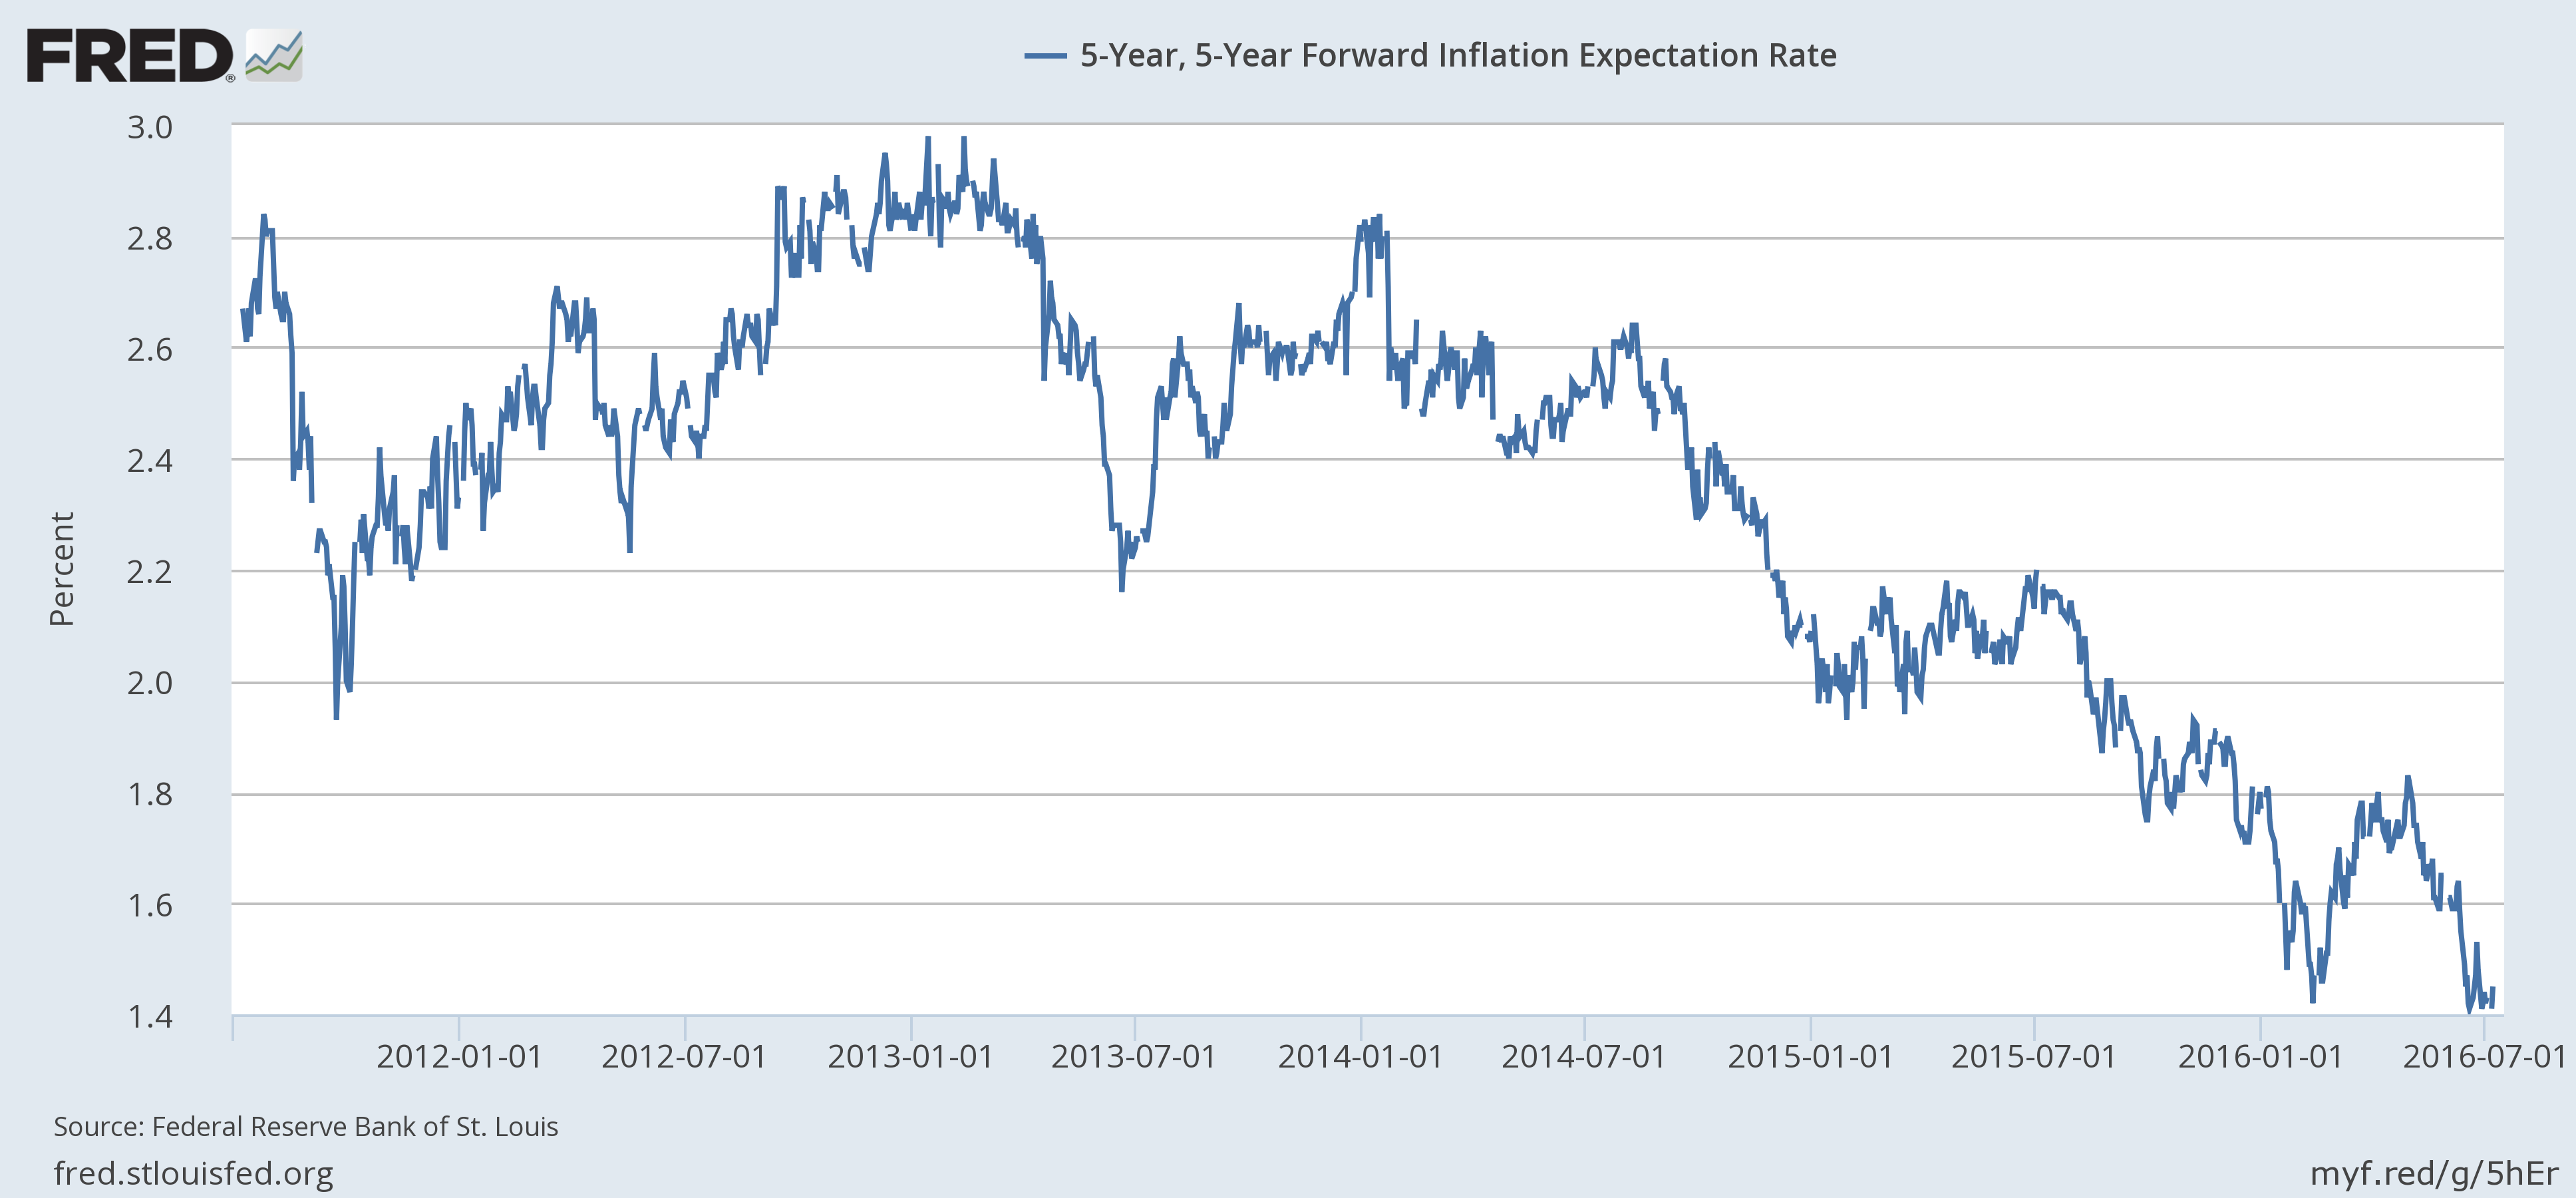
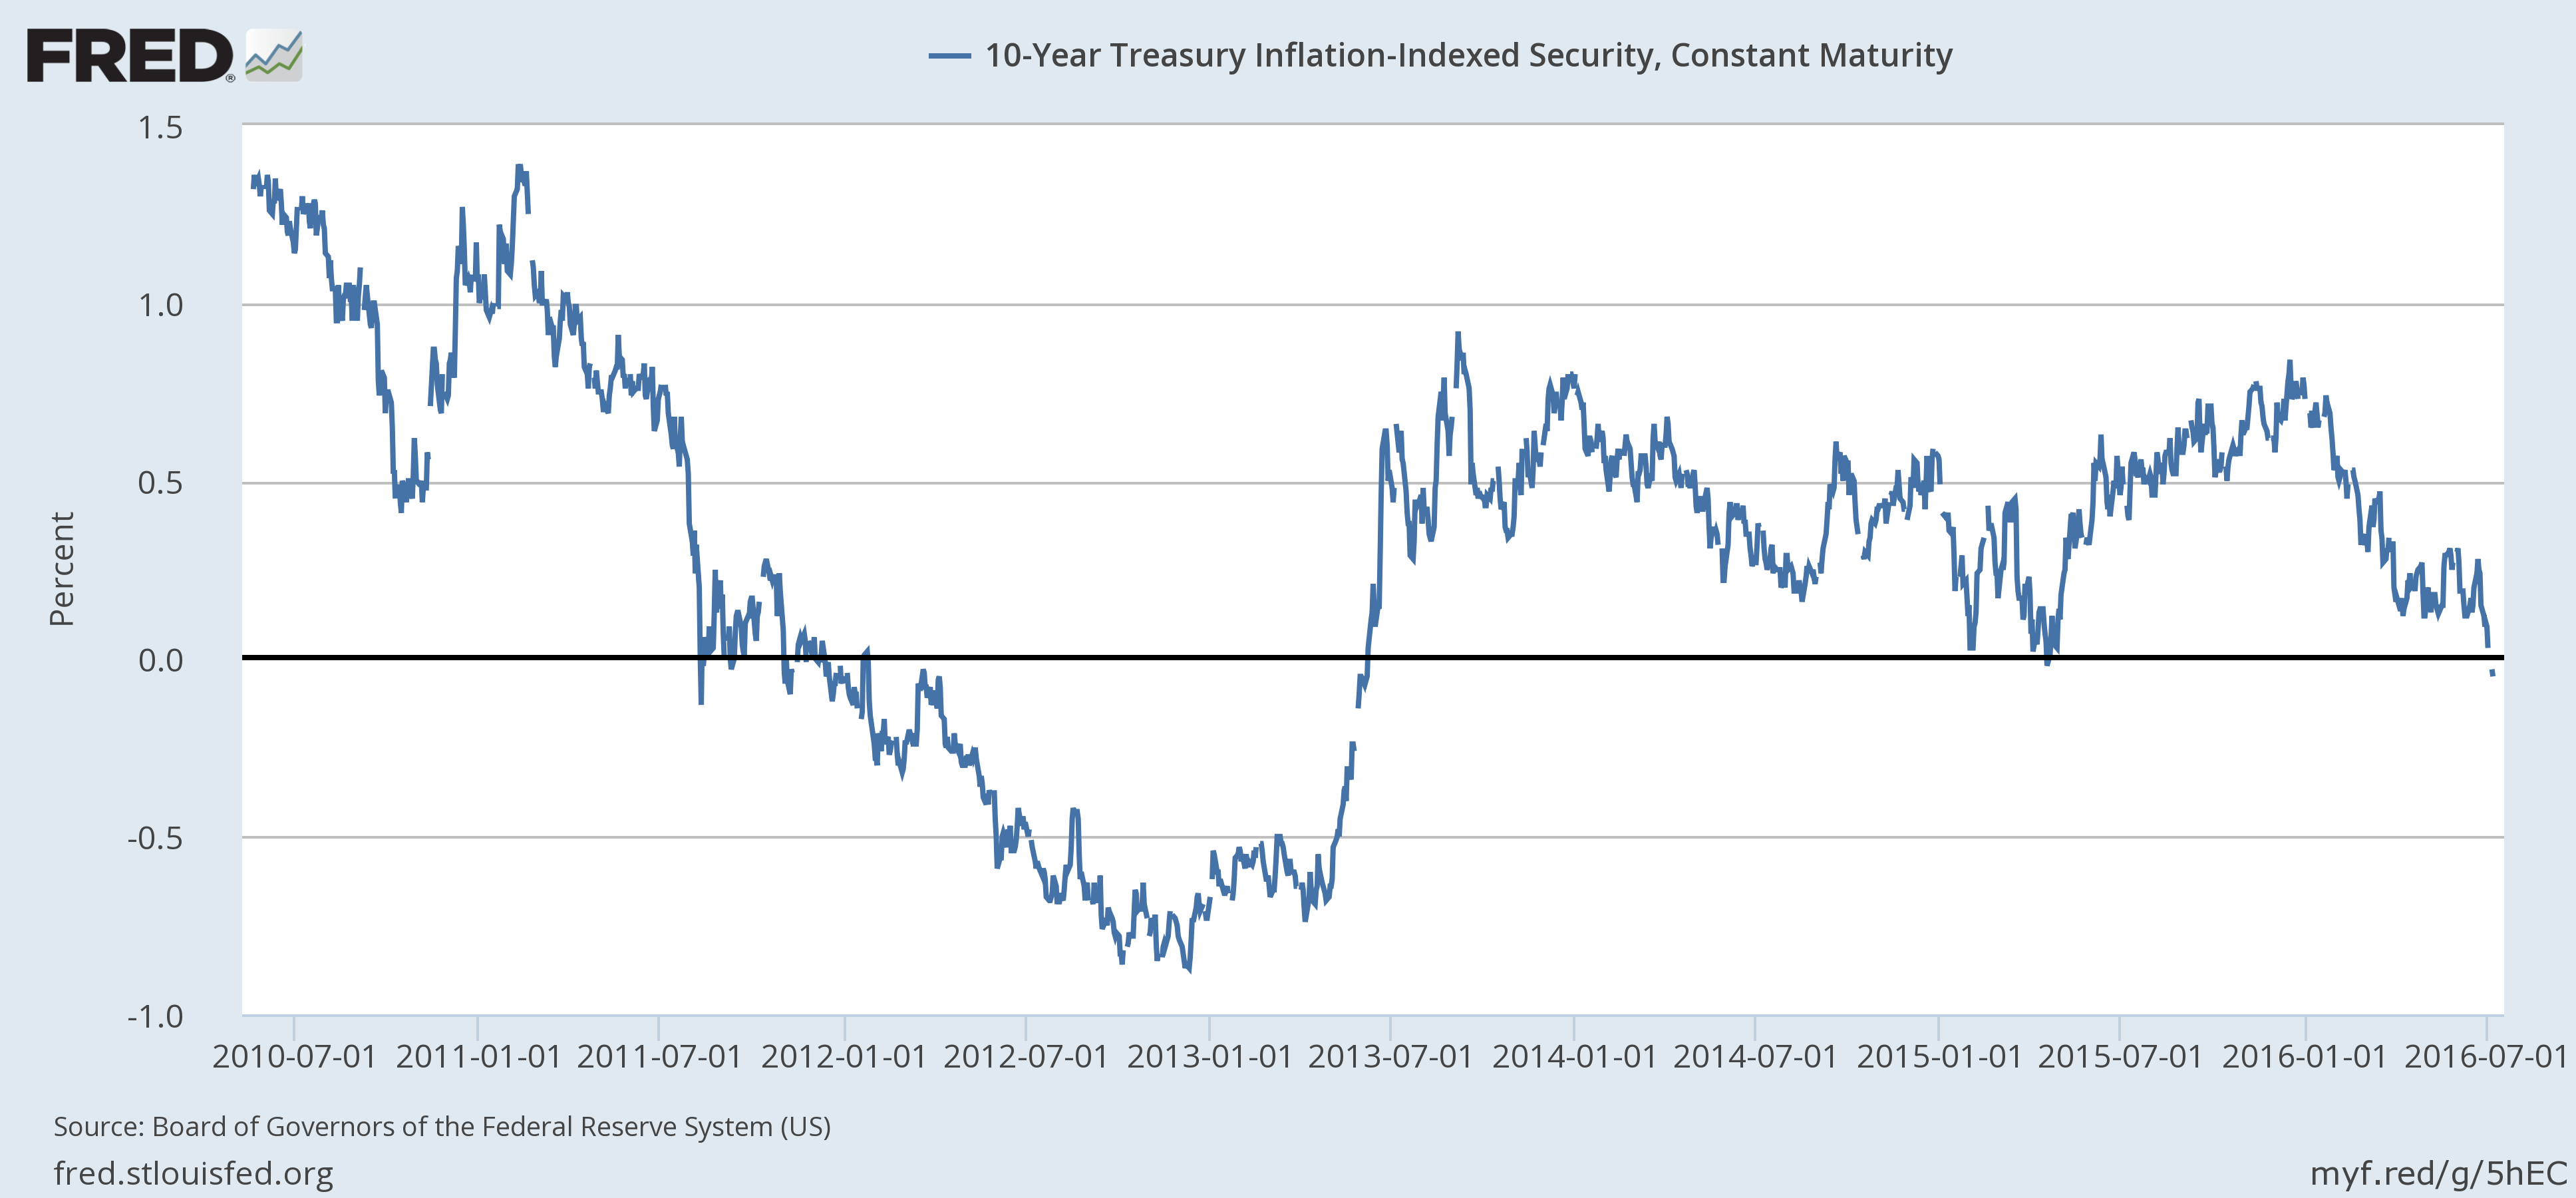
What’s driving the bond rally is a drop in growth expectations with nominal and inflation protected bonds moving in lockstep. 5 year TIPS yields have been negative for a while but now real yields are negative out to the 10 year.
The yield curve is still flattening and is now the flattest it has been since 2007. Recently, a major brokerage firm analyst used that fact and some rather fanciful math to say that it means there is a 60% chance of recession in the next 12 months. We may well have a recession in the next year but the history of the yield curve doesn’t support that conclusion. One thing to note is that the curve was steepening in 2007 versus today’s still flattening curve. What is most often noted about the yield curve is that it goes completely flat or inverts prior to recession. While that is true, it is perhaps important to note that the curve starts to steepen rapidly just before the onset of recession. And that is not happening today.
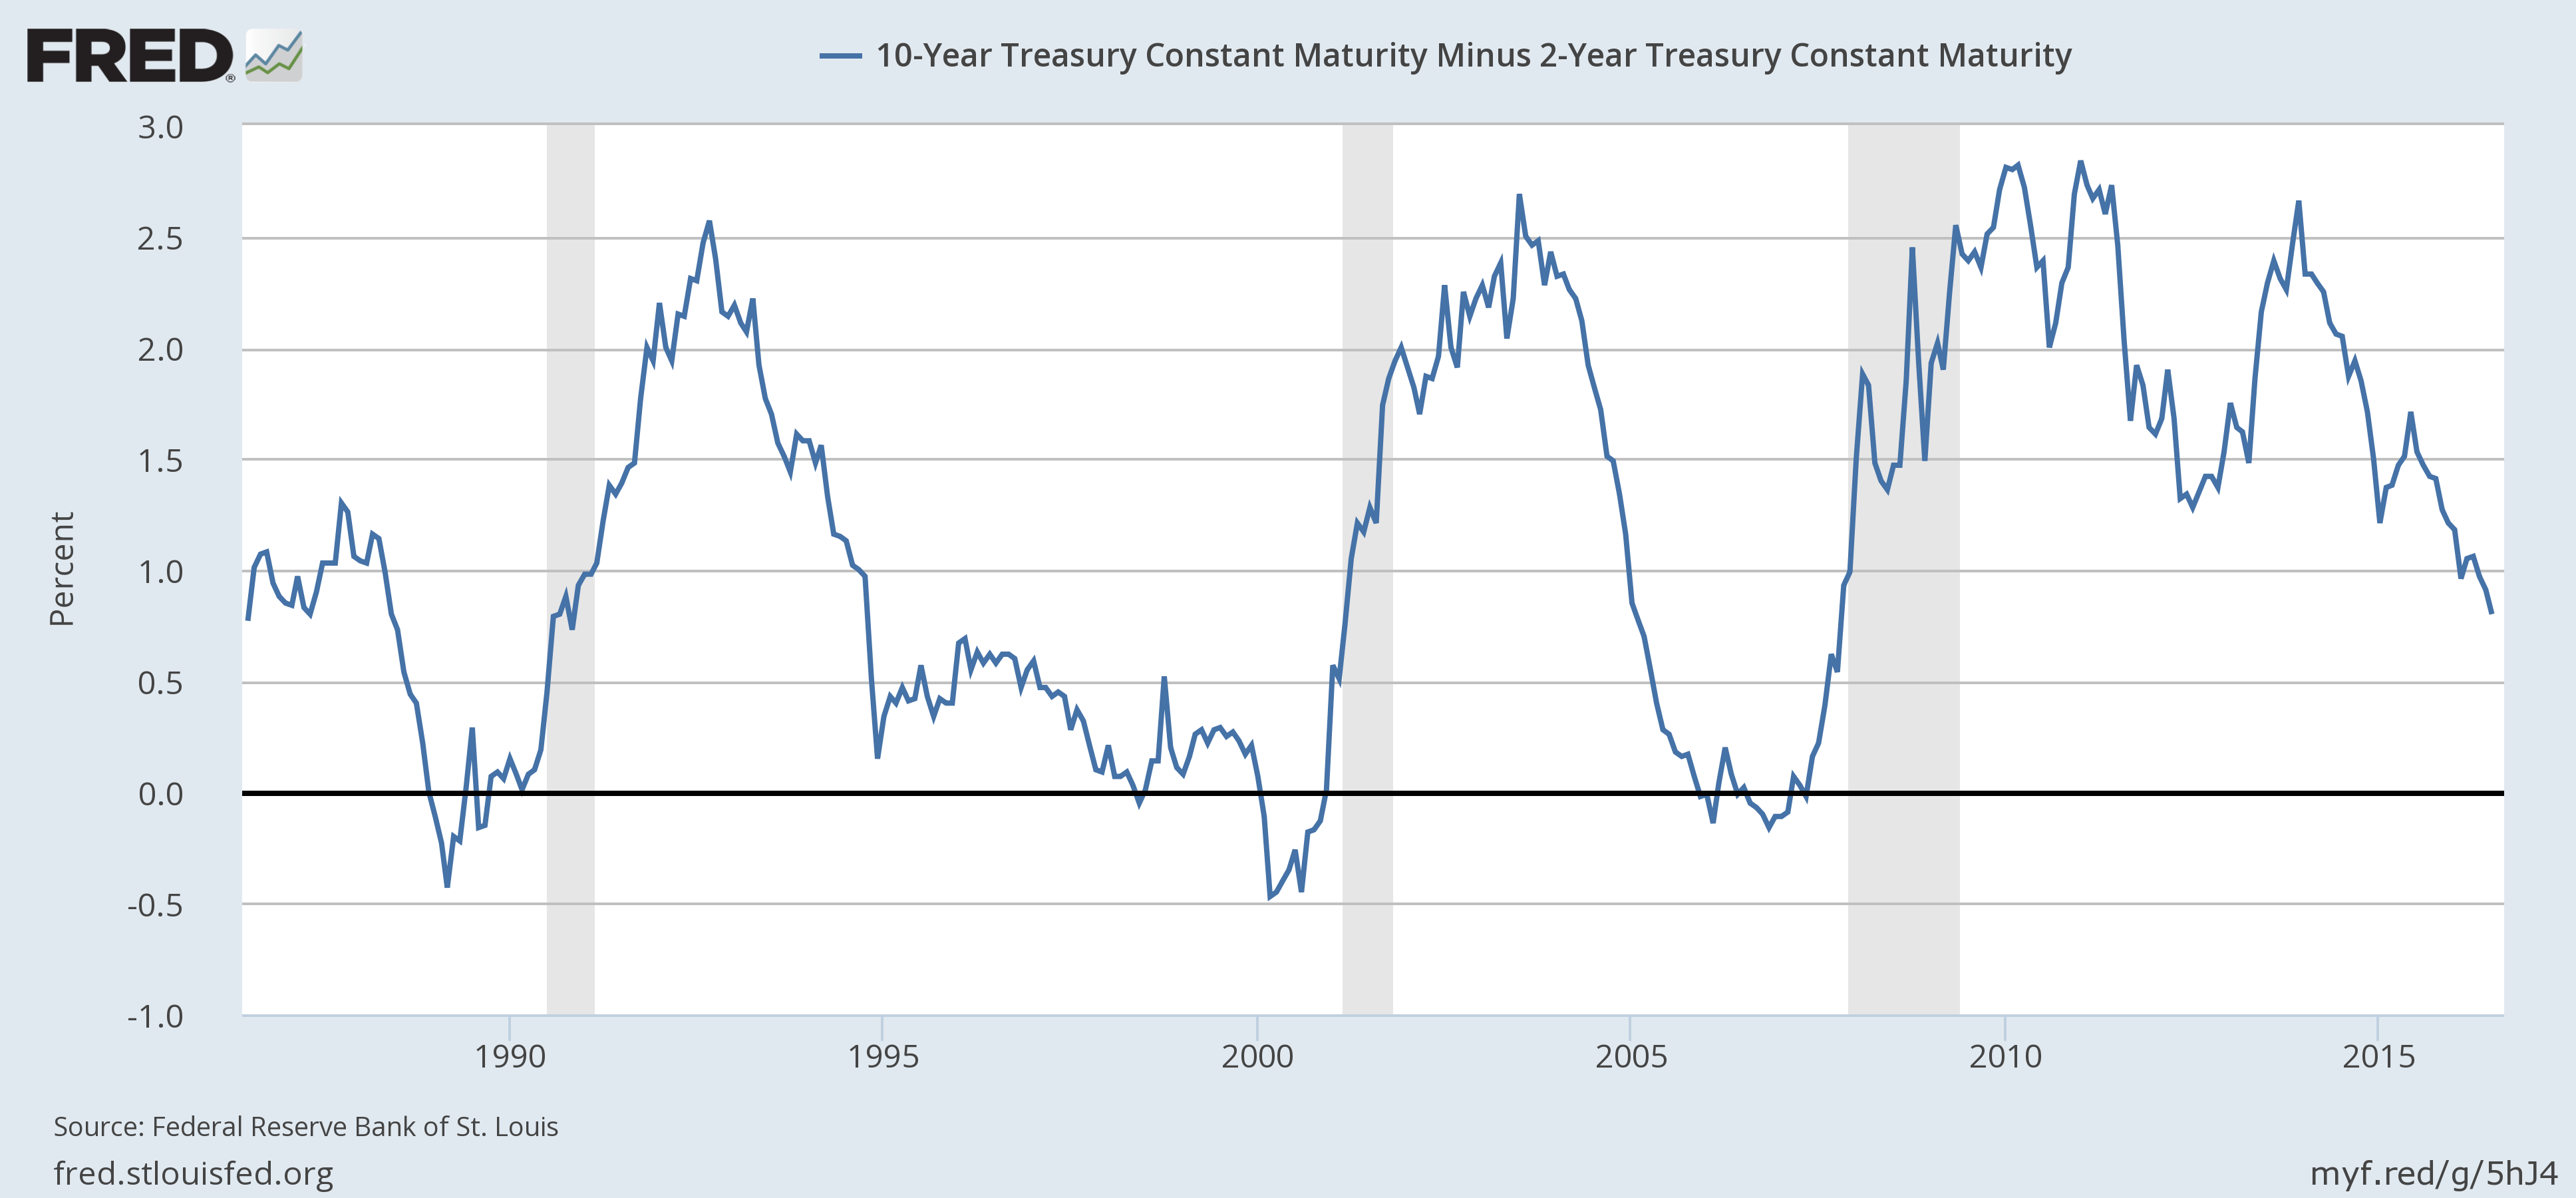
Does that mean the analyst is wrong and the odds are something different than 60%? I have no idea and neither does the analyst. We haven’t been in this situation before so we don’t know what will happen with the yield curve prior to recession. Will it steepen before recession? The steepening that has happened in the past has been due to a collapse in short term yields as the market anticipates a Fed rate cut. Can that happen with rates this low already? Maybe, maybe not; there is no way to know frankly. What we can say is that a flatter yield curve is negative for banks and other lenders who borrow short and lend long.
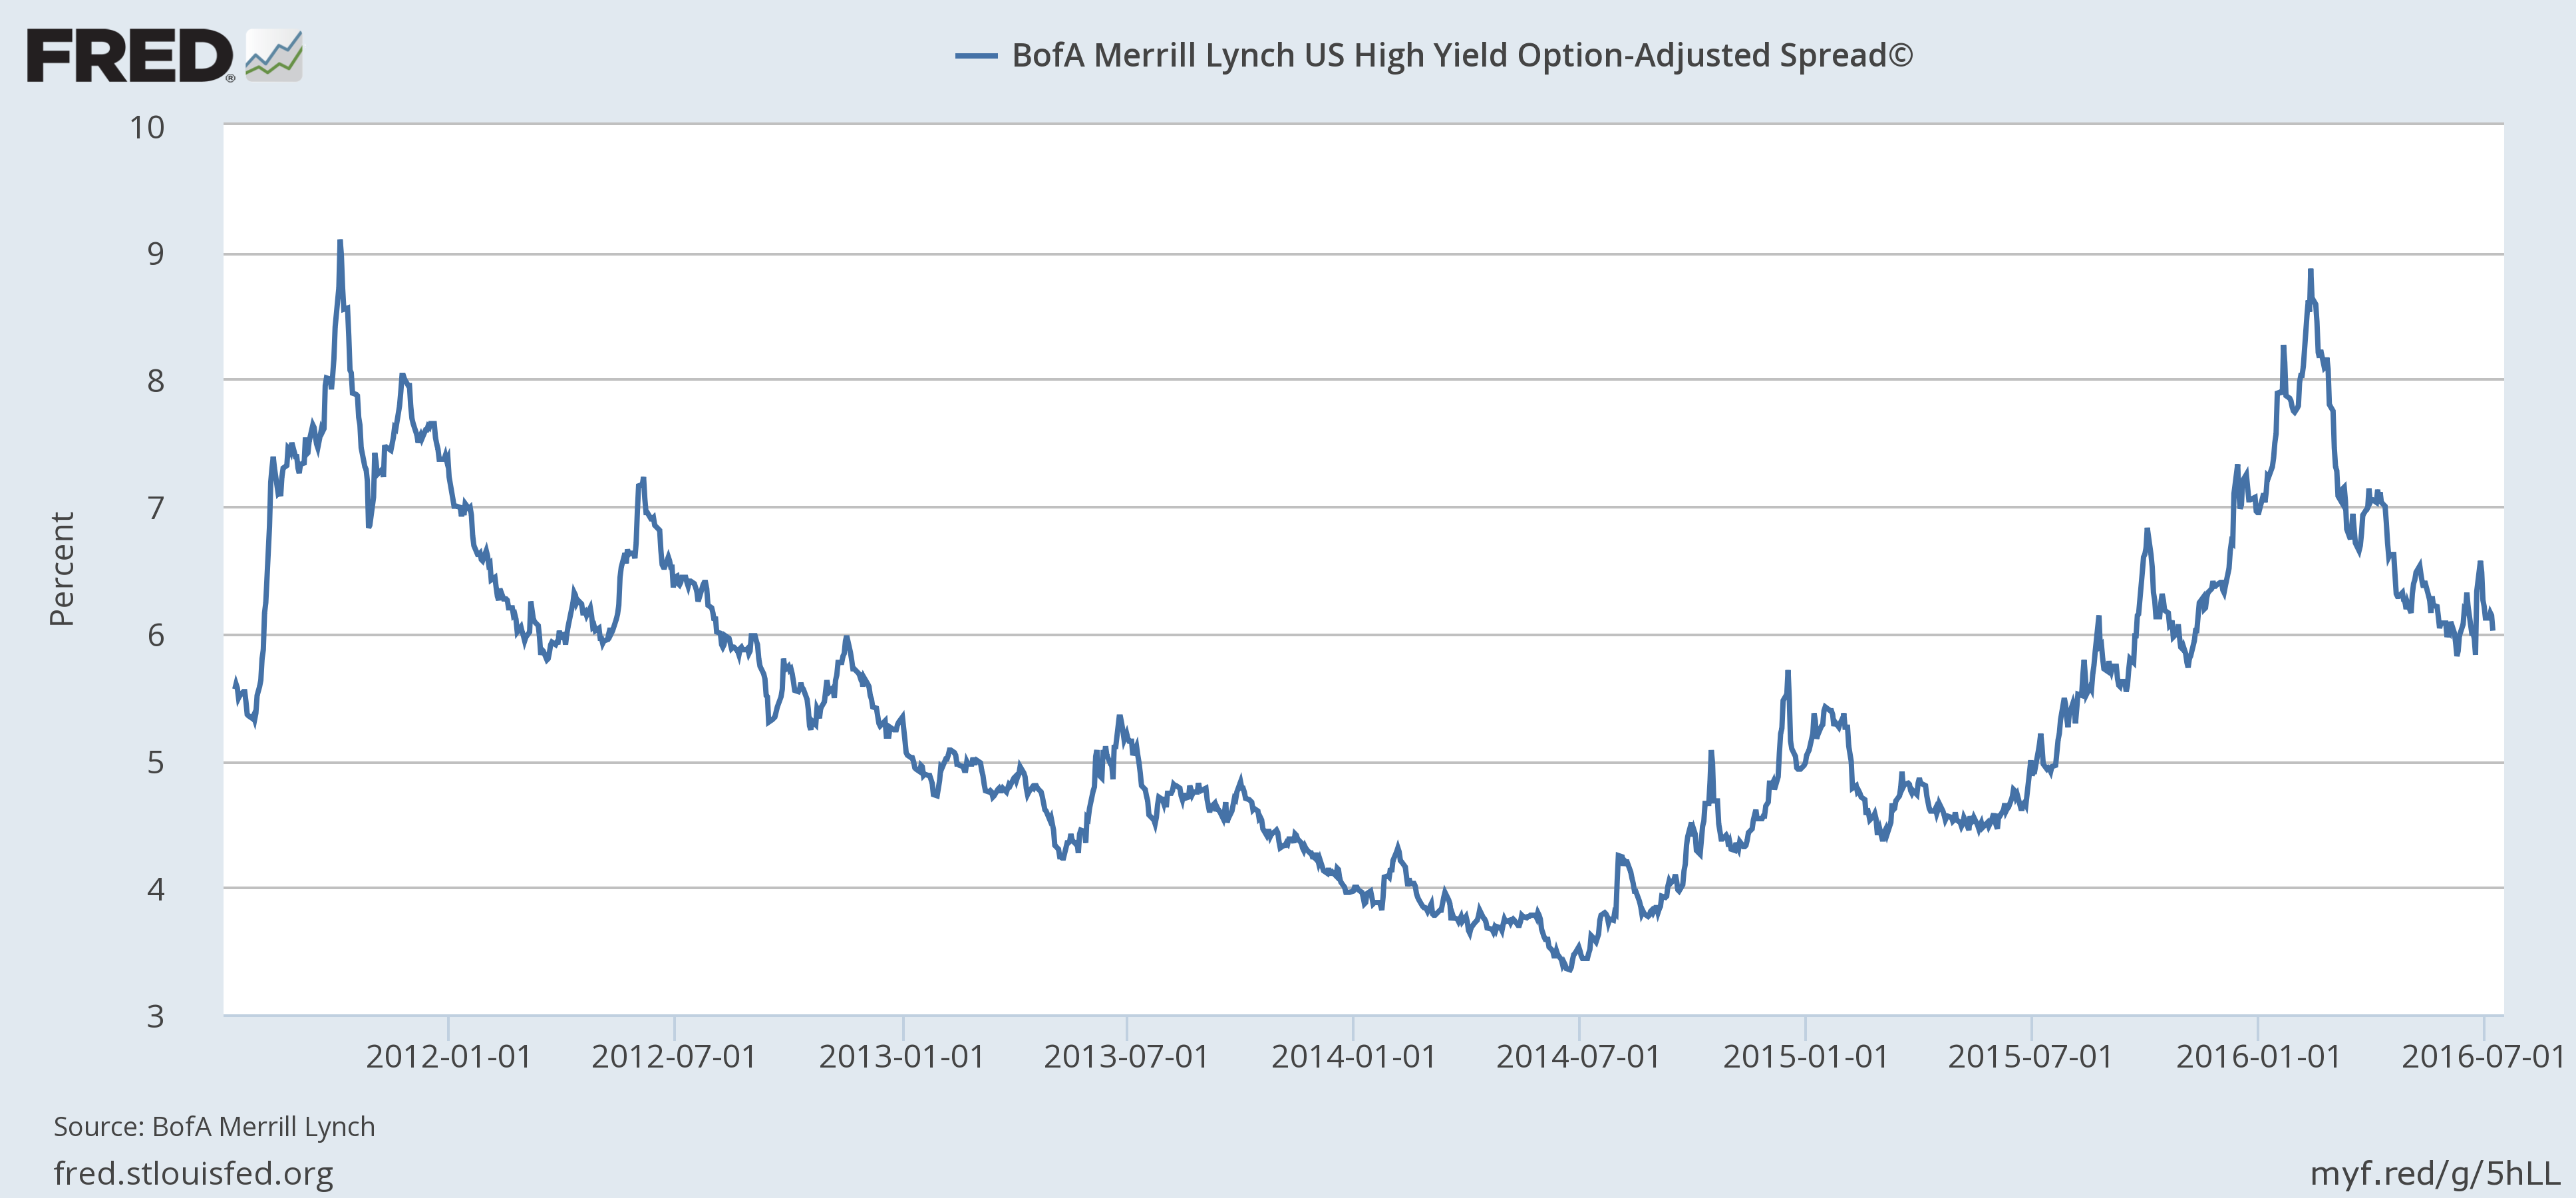
The big drop in Treasury yields has also stopped the short term narrowing trend in credit spreads. Junk bonds have not performed badly; they just haven’t performed as well as Treasuries. Spreads are still, however, quite a bit wider than they were when they started to widen in mid-2014 and so continue to indicate some stress in the system.
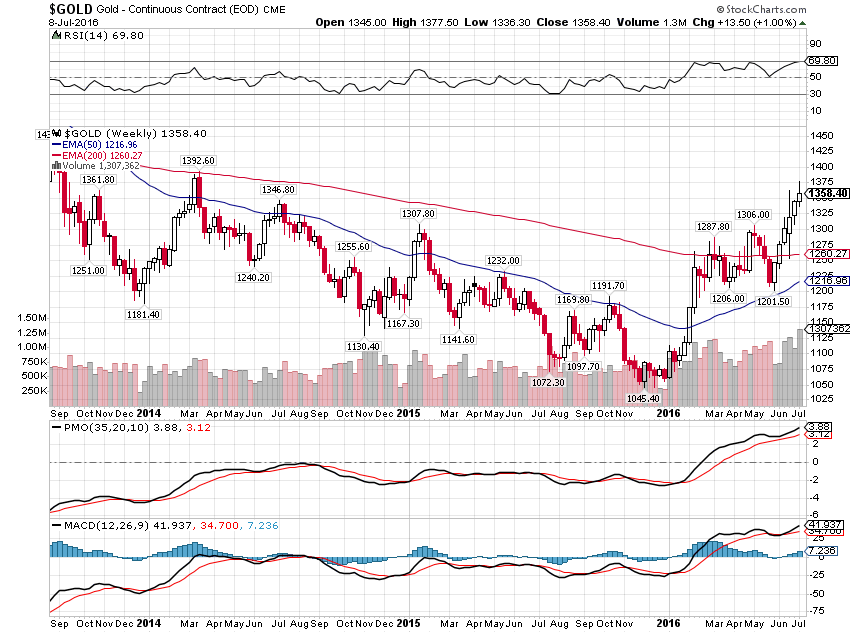
Gold continued its bull run making new highs for this move. This is not a bullish economic sign either if it continues, an indication that investors are more interested in capital preservation than investment.
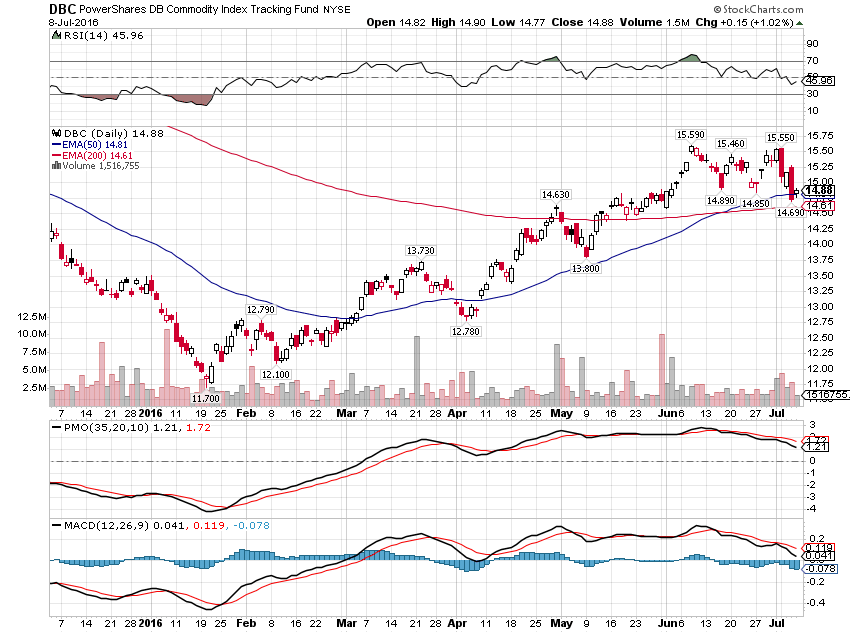
General commodities stalled over the last two weeks but the trend is still higher:
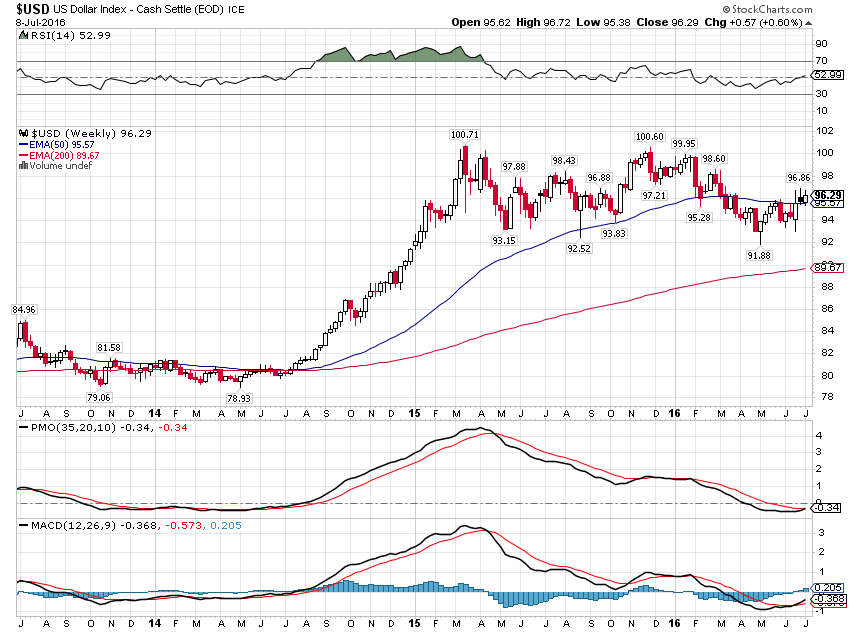
For the commodity rally to continue, the dollar will probably have to break out to the downside. While the dollar did rally on the UK vote, it hasn’t done much since. With real rates negative in the US and positive in a lot of other places around the world I expect the dollar to resume its fall. But so far, the most remarkable thing about the dollar over the last nearly two years is its stability. That is a positive for growth if it can continue. With all the central bank machinations I have my doubts but the longer it lasts the better.
Markets are sending mixed signals on the economy right now. Stocks and commodities seem to be pointing toward better growth to come. Bonds, the yield curve, credit spreads and gold are pointing in the opposite direction. That may just be a reflection of the economic data itself which is also confusing and contradictory. If markets are trying to tell us something about the future of the economy, it must be speaking in tongues. For now, confusion reigns.
Click here to sign up for our free weekly e-newsletter.
“Wealth preservation and accumulation through thoughtful investing.”
For information on Alhambra Investment Partners’ money management services and global portfolio approach to capital preservation, Joe Calhoun can be reached at: jyc3@4kb.d43.myftpupload.com or 786-249-3773. You can also book an appointment using our contact form.
This material has been distributed for informational purposes only. It is the opinion of the author and should not be considered as investment advice or a recommendation of any particular security, strategy, or investment product. Investments involve risk and you can lose money. Past investing and economic performance is not indicative of future performance. Alhambra Investment Partners, LLC expressly disclaims all liability in respect to actions taken based on all of the information in this writing. If an investor does not understand the risks associated with certain securities, he/she should seek the advice of an independent adviser.
Stay In Touch