
The June 2016 FOMC statement included an admission that the labor market might not have been quite as unassailable as had been thought dating back to 2014. That was likely the reason for the assumed change in stance, as even KC Fed President Esther George was unable to bring herself (LINK HERE) to vote against sticking with the 25 – 50 bps range for the irrelevant federal funds rate. The statement was not all gloom, however, as it made a conscious effort to balance Establishment Survey disappointment with a couple “bright” spots.
Although the unemployment rate has declined, job gains have diminished. Growth in household spending has strengthened. Since the beginning of the year, the housing sector has continued to improve and the drag from net exports appears to have lessened, but business fixed investment has been soft.
Almost every indication of the “goods economy” continues to contract, so “household spending has strengthened” is the most glaring and obvious departure from the data. The reference to “drag from net exports” might be technically correct, but not in a manner that would suggest anything good about either the US or global economy. That leaves “the housing sector has continued to improve”, which invites far too much parsing than the FOMC statement really deserves. I suppose the word “improve” permits enough semantics such that what we find in housing might fall under that categorization – but barely and certainly arguably.
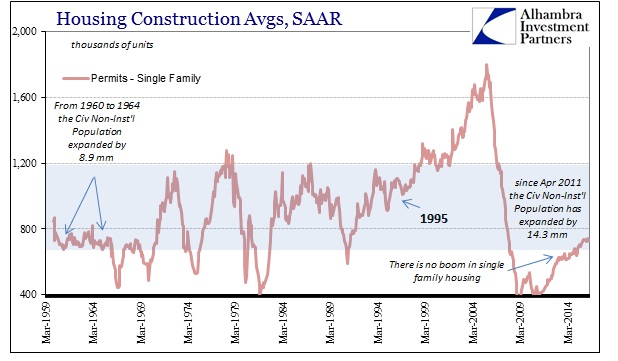
Whether or not home construction (or even resales) conforms to the statement is quite beside the point. If the US economy were truly booming, housing would be, too. Barely improving is a contradiction to that narrative. Enough time has passed, and the population expanded sufficiently, that housing really should be at least starting to normalize its pace. Since April 2011, when housing really bottomed out, the civilian non-institutional population has increased by 14.3 million; dating back to the pre-recession peak in November 2007, the population has increased by more than 20 million. While construction in the single-family housing segment has “improved”, in historical context it is nearly meaningless.
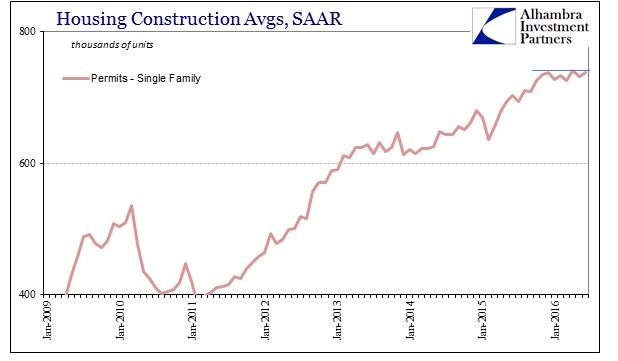
In isolation with just the perspective of the recovery since 2011, the increase in housing construction does seem almost impressive. But even in that view, the gains recently have disappeared; total permits have stagnated for eight months now dating back, unsurprisingly, to last November (738k SAAR in June 2016 vs. 735k SAAR in November 2015). That sudden lack of improvement is matched in single family starts in exactly those same eight months (778k SAAR in June vs. 786k SAAR in November).
That means that there is a very good chance (though housing stats are volatile even in the adjusted sets, eight months is enough to reasonably suspect a real change in housing beyond just statistical variance) that the single family segment has stalled out not at a robust level but at a pace of construction equivalent with the early 1960’s, near the bottom of the historical range. In the five years from 1960 to 1964, the civilian non-institutional population expanded by 8.9 million people; a better rate of growth but a much smaller base than now.
So despite 60% more population expansion in the last five years, the pace of single family home construction is only just now since late 2015 reaching the same levels as were achieved a half century ago. “Improvement” in this context seems much less impressive and actually somewhat concerning given these imbalances.
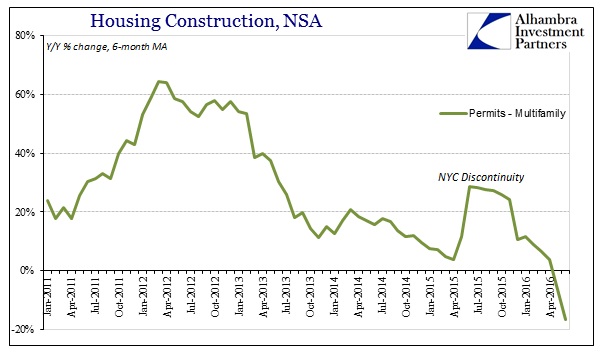
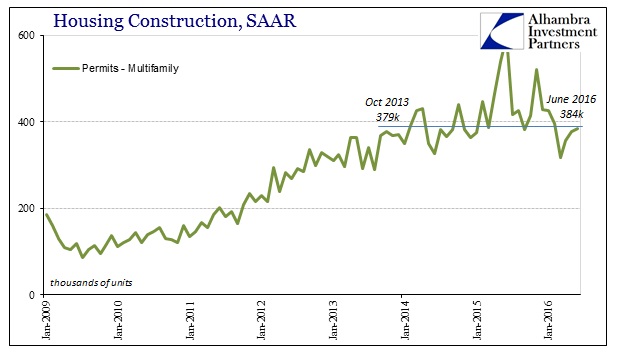
That is especially true since apartment construction is no longer recovering at all. For the past few years, whatever “improvement” in overall housing construction has been delivered by the single family segment. More recently, construction of multi-family projects has actually declined. Permits for apartment units were down almost 40% year-over-year in June (NSA), though that was due to the base effect of the NYC irregularity from June 2015. However, that only obscures the true measure of the decline since filings for multi-family permits have been contracting since February; the drops in April and May were -23% and -24%, respectively.
On an adjusted basis, the level of multi-family permits in June 2016 (384k SAAR) was barely more than October 2013 (379k SAAR). The same holds for starts, just one month different (392k SAAR June 2016 vs. 383k SAAR November 2013). Outside of a few months here and there, multi-family construction has been stalled for years, stuck at least in an unstable trend that stands in contrast to an improving labor market (“best jobs market in decades”) and economy.
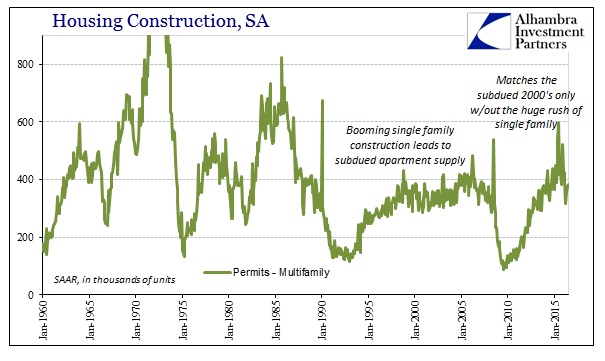
As with the single family portion, multi-family permits in historical perspective are even less remarkable. At around 375k to 400k, that is the same pace as during the housing boom where the enormous surge in single family construction kept apartment activity to a minimum. In 2016, apartment permits are stuck at that minimum with but a fraction of the single family level.
I think there is far more here that adds up to a concerning change in home construction and activity, and far less that suggests “improvement.” It is also quite consistent with those “goods economy” data sources belying the idea of “household spending has strengthened.” You could even add the Establishment Survey to that view, as the average gain in headline payrolls declined sharply to start 2015, and then again to start 2016. An actual softer labor market, especially sustained in that condition, would certainly account for stagnation in single family construction.
From a more general, non-monetary policy view, housing just isn’t nearly what it likely “should” be given population and the overhang from the bust. It remains especially constrained, though obviously these housing construction estimates don’t tell us why. Despite the FOMC’s best attempts, however, there isn’t much of a leap to reasonably figure what might be wrong.
Stay In Touch