
US Industrial Productions continues to more and more resemble the worst of the Euro$ #3, that “manufacturing recession” of four years ago. Back at the end of 2014 and lasting well into 2016, IP was led lower by the oil crash among other problems. They called it a supply glut but we all know that wasn’t ever the case. What changed was demand, and the lack of sufficient demand caused production to eventually plummet.
In other words, one of the only parts of the US economy that had been actually booming up until late 2014 was suddenly transformed into one of its weakest. For IP, the cutbacks amplified the “manufacturing recession” increasingly evident in one of the oldest economic accounts in the United States catalog. When IP goes negative, nothing good can be happening.
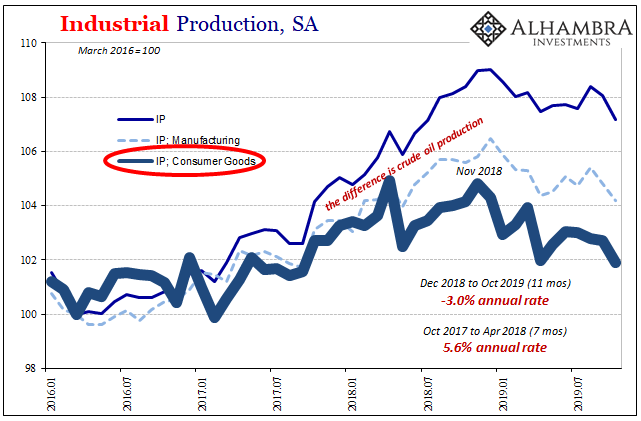
This time around, crude production is waning though not yet negative. Oil prices didn’t exactly crash during last year’s landmine, but they did come down quite a lot. It was a serious second setback following that first one five years previous, meaning for a lot of producers a pretty big sign that $100 oil isn’t a given – and may actually take a miracle for crude to ever get close again.
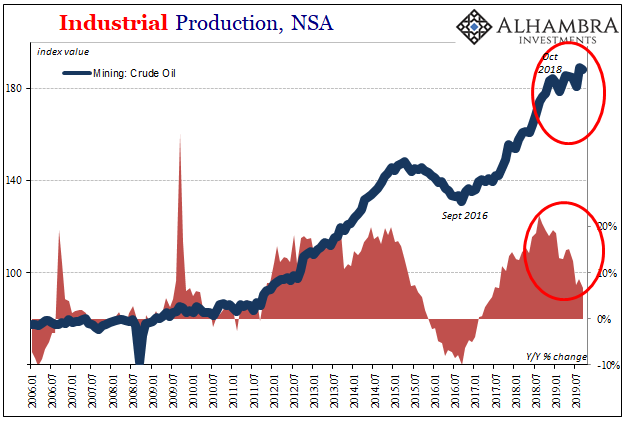
For the statistic itself, the Federal Reserve suggests that the level of production is still relatively decent – as it was midway through 2015. In the latest figures for the month of October 2019, released today, this one part of the mining index was 6.6% more than it had been in October 2018. On average, production is still rising at about a 10% rate.
And yet, Industrial Production as a whole, the headline index, fell by more than 1% year-over-year in October. Not only is that a rare negative for overall IP, that’s at a rate about equal to the (revised) estimates for the month of June 2015. And in June 2015, the rate for crude production was +7.2%.
As with today’s retail sales, the Fed’s IP series is also suggesting a lot that looks entirely too familiar.
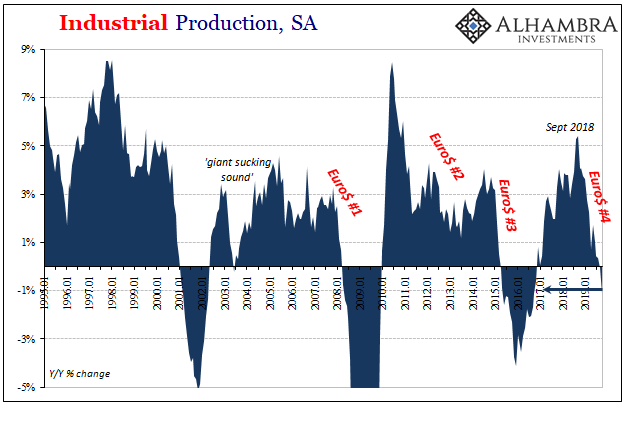
That includes what is now a pretty well-established second straight manufacturing recession. There may not have been one during Euro$ #2, for each of the last two including the latest event there can be no doubt. Other than Euro$ #3 and June/July 1952, if IP achieved -1% the US economy had always been in recession.
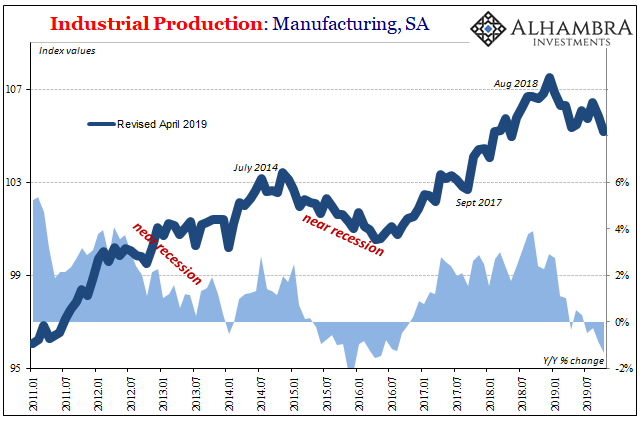
In terms of just manufacturing within IP, it is now falling at a 1.3% year-over-year rate. Dating back to last year’s peak, it’s closer to a 3% annual rate of decline – with a particular emphasis on cutbacks in the production of consumer goods. That’s another point that lines up with retail sales, where in the latter the slowdown/downturn continues without a visible end in sight all the while inventory (as shown in the Census data as well as BEA’s GDP estimates) piles up.
And that can only mean even more production cuts over the months ahead.
There was some noise in October’s estimates to consider. About 50,000 autoworkers employed by General Motors walked off the job beginning September 16. They didn’t reach an agreement on a new contract until October 16, making it the longest work stoppage in over two decades, and the lengthiest one to hit the auto sector in half a century.
The lack of GM production clearly made its way into the Fed’s IP numbers via Motor Vehicle Assemblies (which only count domestic operations).
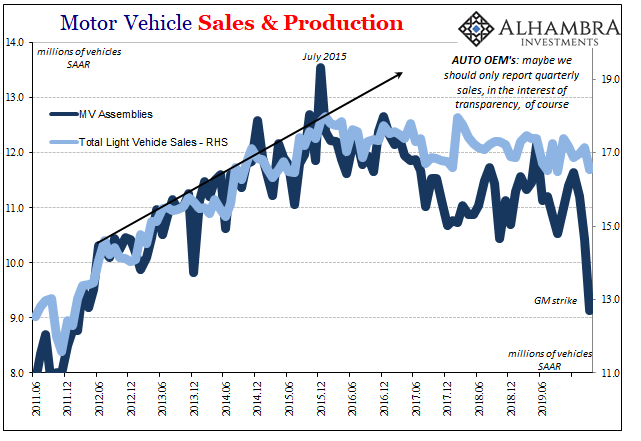
Total MVA’s were barely 9 million (SAAR) during October, the lowest amount since 2011. That means headline IP was dragged somewhat lower by the interruption, and over this month and next there will be some of that made back as GM will rush to catch up on part of its lost production.
But it likely won’t be excessive because there are indications the company had kept production levels somewhat higher than normal heading into September expecting to be shutdown with a labor dispute. Total MVA’s in June, July, and August were above 11 million (SAAR), somewhat higher than normal given continuously slowing sales and growing inventories.
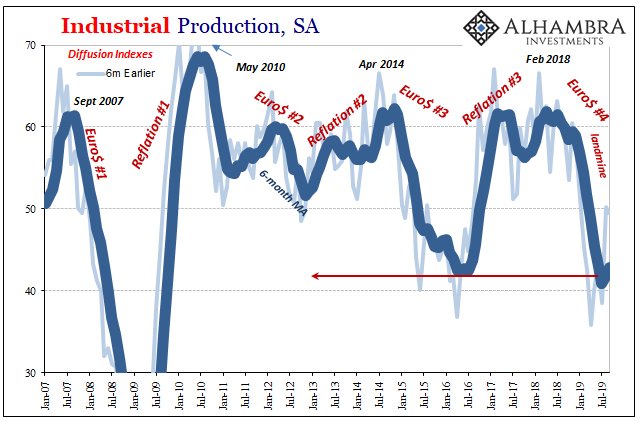
Either way, it’s not been just auto production which was a step weaker during October. The Fed’s diffusion indices tell us the relative number of subcomponents and therefore number of different specific industries within the whole sector that are showing up as negatives. If it was just the GM strike which had impacted the latest estimate, the diffusion index would be well above 50 even if the headline was negative year-over-year; indicating the negative was due to the one factor.
The fact that the diffusion indices (either the 1-month comparison, 3-month, or 6-month) continue to be substantially less than 50 continues to indicate broad-based problems spread out across the manufacturing and industrial sectors. The true manufacturing recession that looks more and more just like the last one (that everyone tried then to ignore, too).
For our immediate purposes, it simply means the economy cannot be strong. Sorry, Jay Powell. You can keep saying it, and you no doubt will, but one of your very own oldest and most reliable indicators shows otherwise. It used to reliably mean outright recession, and even if it doesn’t any longer it does mean the economy right now has to be in pretty rough shape and questionable moving forward.
It erases that second half rebound you’ve been forecasting and counting on, too.
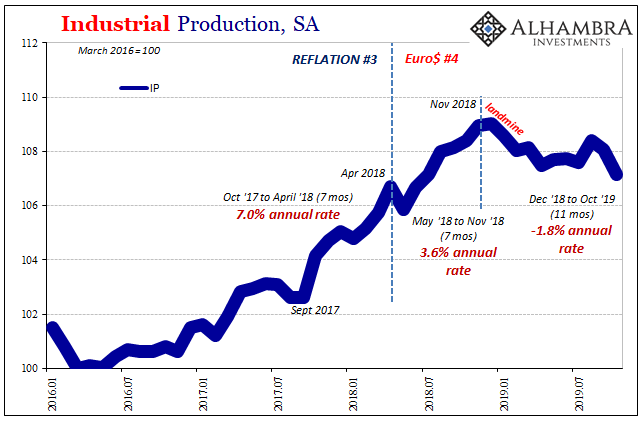
What most people want to know is what that means moving forward. Even if we do repeat Euro$ #3, it’s still a significant economic downturn ahead even if not a full-blown recession. The risks are there, however, especially considering the usual downward benchmark revisions likely ahead (under the original numbers, IP didn’t turn negative until the month of November 2015; today the Fed knows the “manufacturing recession” actually began seven months earlier and was bigger than thought each time it tried to estimate its proportions).
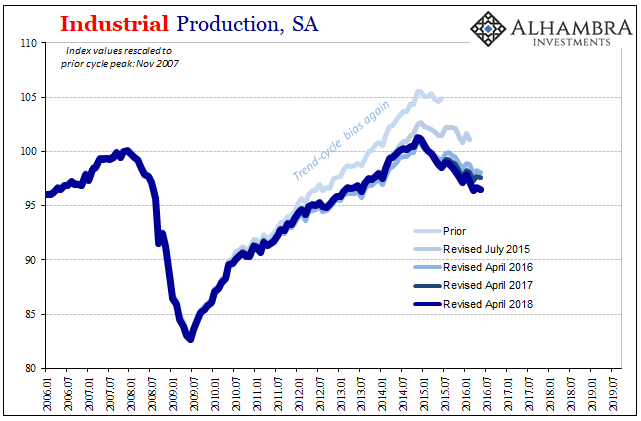
The current numbers say -1.1% for October 2019. The original series starting out with -1.7% for December 2015 now put it at -4%. If October 2019 really is at -4%, with inventory the way it is and retail sales (not to mention GDP), that’s nasty.
As far as forward-looking indications, those all begin elsewhere. As noted above, continued weak retail sales combined with continued high levels of inventory propose continued downward progression. With companies already on edge when it comes to their costs and financial commitments, it may not take much (maybe something more real in repo and collateral?) to turn Euro$ #4 nastier still.
Stay In Touch