
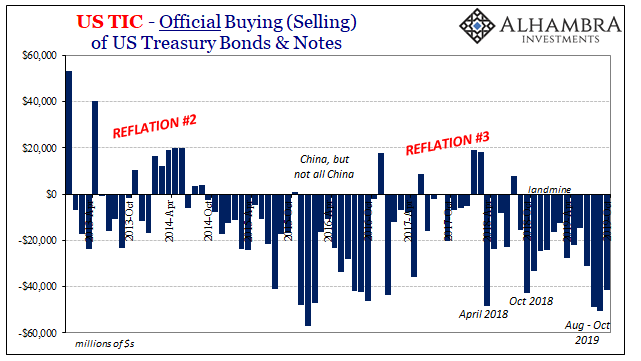
According to the latest TIC estimates from the Treasury Department, foreign governments continued their heavy selling of US Treasuries. During the month of October 2019, the most recent data, the official sector disposed of more than $40 billion of those securities on net. It was the third straight month of substantial declines.
Some observers try to link this kind of selling with falling bond prices (and rising yields). Without overseas governments to buy a whole lot of what the US federal government wants to sell, interest rates, they say, have nowhere to go but up.
The last time foreign holdings of UST’s were “shrinking pretty substantially” was in the same years 2014 to 2016. China sold, according to official figures, nearly $1 trillion in foreign reserves including hundreds of billions in UST’s. During that same period, “hedging costs” rose significantly via cross currency FX. UST yields rose as a result?
Of course not. Because it wasn’t hedging nor was it really selling UST’s. It was a global dollar shortage, another one, which in the end raised liquidity therefore economic risks. The “selling UST’s” was easily offset by, what was it the FOMC said earlier this year, “strong worldwide demand for safe assets.” The two things go together, are inseparable. Dollar shortage is UST positive (price).
UST yields have been inversely correlated with this theory. The more governments tend to sell, in general Treasury rates tend to fall not rise. The reason for it is simply the reason foreign officials are acting this way, and that’s not because they hate the credit risks of an out-of-control US fiscal situation (which is out-of-control, by the way).
Rather, they sell their safest, most liquid (by market reckoning) US$ assets in order to try and make up for what global eurodollar banks won’t readily and efficiently offer their local financial constituents. When global dollar short (the need for $s) meets global dollar shortage (banks increasingly unwilling to supply them on the same terms) overseas officials step in to mitigate the deficiency as best they can.
The results are often not very pretty (except for worldwide holders of safe assets).
What’s noteworthy about the last three months of data, August to October 2019, is how the “selling” has accelerated again. A rolling over after a few months earlier this year where it had looked like the global dollar shortage has perhaps turned the corner.
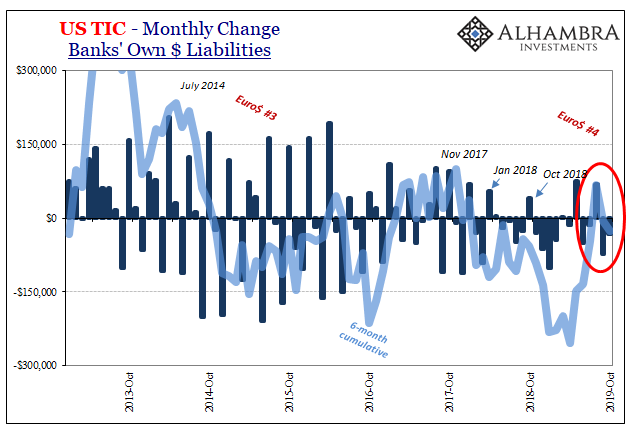
And that correlates pretty strongly with the trend we can observe in banks’ reported dollar liabilities. It isn’t a direct one-to-one relationship, there are all sorts of lags and additional variables that effect each side, but by and large there does exist a corresponding general pattern between the direction of bank liabilities and how the foreign official sector tends to manage its US$ “reserves.”
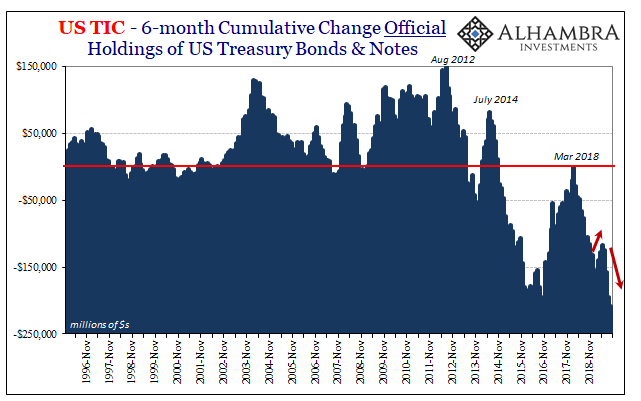
You can see what I mean below. The first chart is the month-to-month change in bank liabilities. The second takes the 6-month cumulative total of them and plots it alongside the same thing for official net changes in UST holdings.
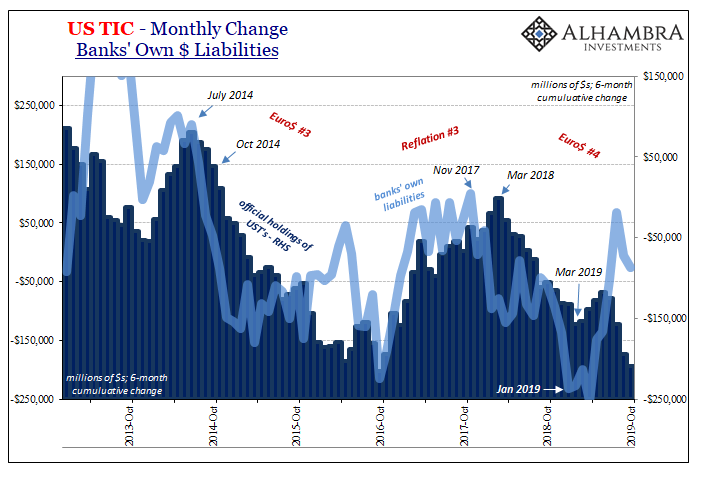
Again, it’s far from a perfect relationship but the overarching trends do match up pretty well.
If it continues (two months of TIC and some other data, like Z1) this may be a growing problem moving forward. Both sets of figures seem to have rolled over sometime during the summer, therefore suggesting that, factoring those lags, there may be more rough months ahead for the global economy.
In other words, banks may be back at it in terms of accelerating (2nd derivative; gamma) the shrinking of their offshore balance sheets on offer – which may explain why foreign governments have been so busy the past few months trying to raise “dollars” by selling UST reserves.
The possibility is further suggested by other key parts of the TIC data. Japanese banks, as I’ve been arguing for almost two years, have played a central role in Euro$ #4. As discussed here, once the Chinese government declared globally synchronized growth to be a lie, institutions in Tokyo immediately ran for the exits (risk/return profile of redistributing dollars, one form of carry trade, had changed).
That was late in 2017, the major inflection point which shows up pretty much everywhere (even BIS data).
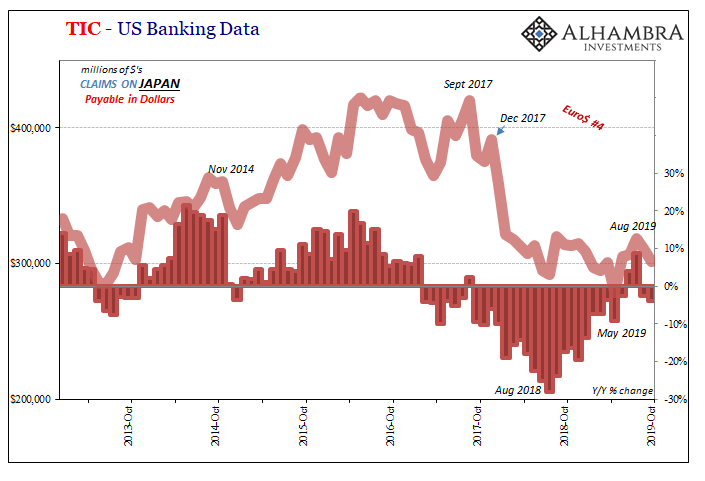
This Japanese withdrawal was met with massive instability all throughout the global system, leading to lagged effects in the dollar, economy, and then financial markets.
There had been something of a reprieve also in the summer months of 2019 (shown above). But, like the other data, for two months now a change in direction, a possible rolling over of Japanese marginal tendencies in this all-important redistribution function.
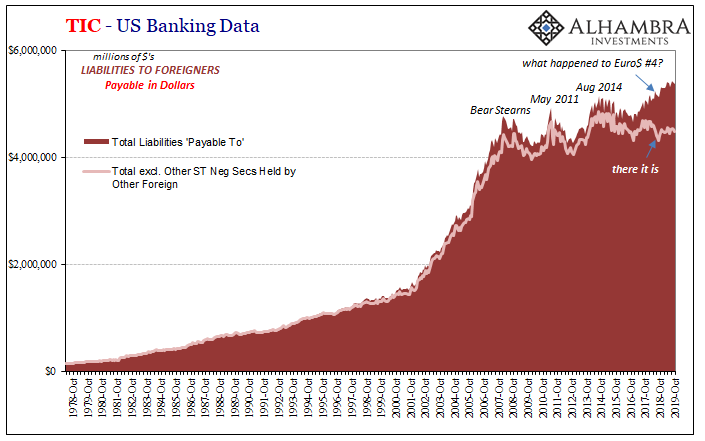
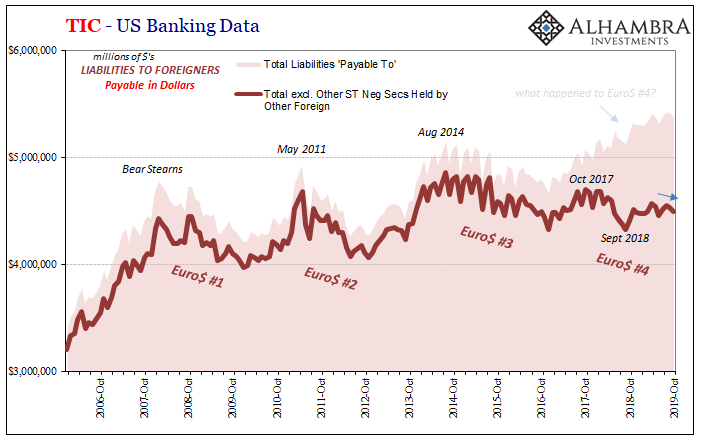
That all comes against a background that is increasingly unfavorable; not disastrous, but definitely moving back toward the wrong direction. If we use total TIC values (above) as partial proxies and reconstructions for what the larger situation offshore might be, in dollars, that baseline situation was never all that good to begin with.
In other words, after the initial pounding in early 2018 following through to become the much larger landmine by the end of 2018, things somewhat settled down at least as far as the TIC data suggests. The reverberations and second (third) order effects continued to be felt especially earlier this year, but for a time it appears as if the eurodollar market switched from actively seeking the exits to a more wait-and-see approach.
For a few months that meant foreign governments didn’t have to sell as many UST’s.
The problem with a wait-and-see period is that during it everyone has to see something meaningfully different, an actual change to more positive conditions (risk profile), or else they’re going to start moving back toward the exits again.
What the TIC data suggests, for a few months, anyway, that’s been the trend underlying in the offshore dollar spaces. Inching toward the exits. While outwardly the world seems like it’s moving in the right direction, even in places like the UST market where yields have backed up somewhat since early September, there may be a return to more anxiousness underneath it all that just hasn’t become, or hasn’t yet had enough time to become, the more outwardly disruptive negative pressures.
To me, that seems a likely explanation for why, despite “trade deals” taking over the whole narrative, the bond market, at least, hasn’t really caught fire with reflation like a lot of people seemed to have been expecting. The conventional view is that the recession fire has been put out by central banks acting in the nick of time.
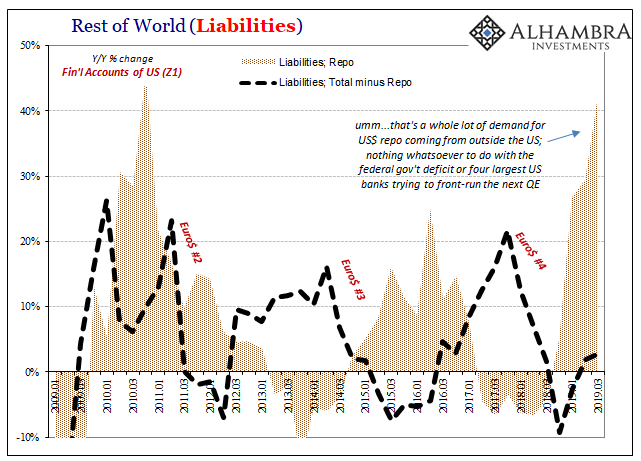
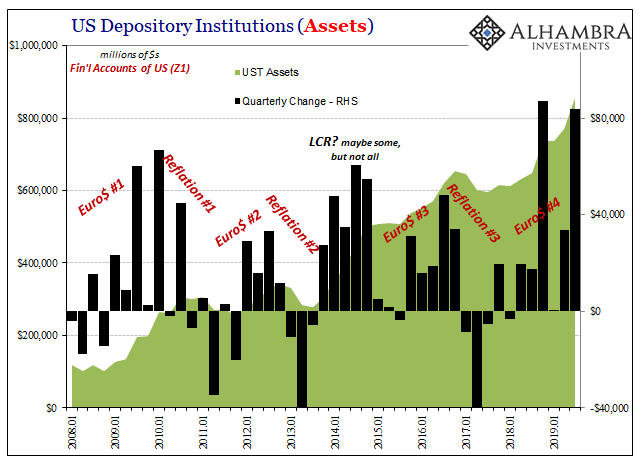
The TIC data, however, agreeing with Z1, shows that it is otherwise possible the smoldering dollar fire, which is what all the smoke had been in the first place, continues to smolder and may be heating back up again the past several months. Perhaps that’s why US bank holdings of UST’s skyrocketed during Q3, and, apologies to all the talk about a repo-calypse, foreigners continue to lean on repo as the real liquidity lender-of-last-resort.
Why are funding markets really keeping the Fed so busy? If TIC is right, consistent with Z1, it doesn’t have much to do with G-SIB surcharges and the level of bank reserves. It starts much deeper and much further back, and more recently perhaps rolling back over toward those same things.
Stay In Touch