
As usual, a couple of additional odds and ends leftover from TIC that are worth a few brief mentions. And then a reminder of the caveats which come along with them (and all the interpretations).
1. First up, China. 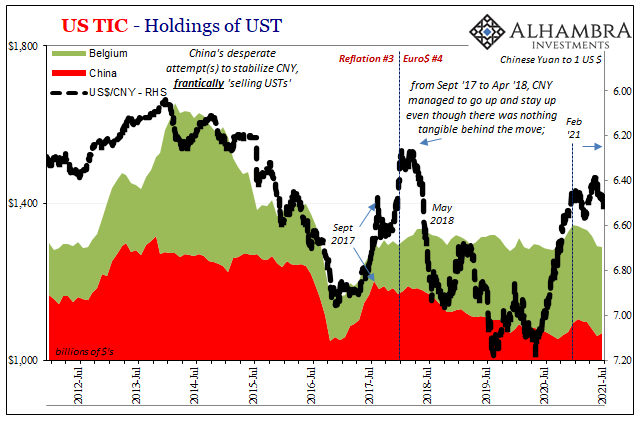
According to the latest TIC data, mainland China added a few billion to its UST holdings during July 2020, while those belonging to someone (China) posting through Belgium declined by a few billion more. Netting the two, a small decline otherwise more consistent with a weaker CNY (rising dollar) and yet that was the month when the Chinese currency really traded in its suspiciously narrow range.
There isn’t a one-to-one with what’s in TIC; meaning that CNY can and does move independently of what might be indicated in China’s holdings of Treasuries, at the same time the latter can be noisy in the short run being affected by who knows what (see: below at the end) with data constraints, Communist priorities, and a whole range of stealth capabilities beyond our capabilities to uncover.
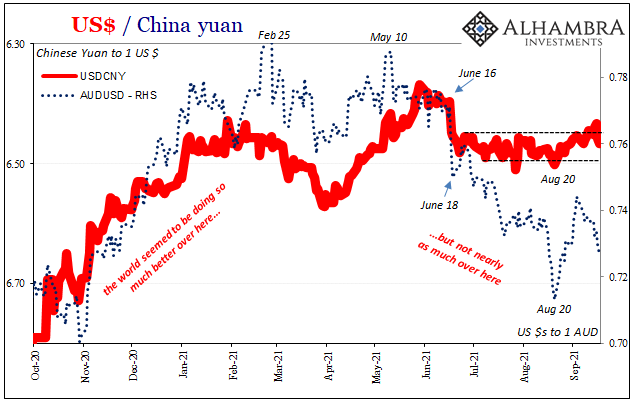
But July’s TIC does continue the weaker CNY trend, or more in line with dollar shortage indications all over the place whatever is up – after August 20 that’s been yuan, slightly – with the Chinese.
2. Next, this might turn out to be a much bigger deal down the road, maybe even soon, but for now it is just a single monthly negative. Private net activity in reported US$ corporates: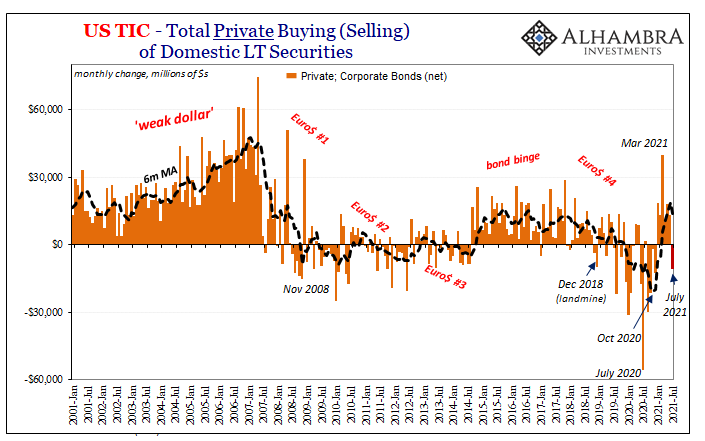
For the first time since last December, TIC shows a sharp drop meaning, on net, more corporate securities were sold than bought.
As you can see above, this was one of the first indications from late 2018 that Euro$ #4 was turning pretty nasty heading through its landmine on into 2019. It also related to collateral, as junk corporates were the primary infection of the global US$ collateral pool meaning the growing rejection of them was almost certainly expressed in repo and derivatives (securities lending) by bigger haircuts, risk aversion, a falling collateral multiplier herding participants more and more into only the best quality collateral (eventual bottleneck).
For the first three months of this year, foreigners were all over corporate bonds and while TIC doesn’t break it down by type (how much was junk, we don’t know) we can reasonably surmise there was probably quite a bit of risk-taking given especially January and February inflation hysteria (predicated on a far more optimistic view of the global economy therefore reduced risks generally).
The favorability faded by June and now this net selling in July. If it remains just the one month, maybe nothing more than technical reasons or seasonal quirks (or UFO’s). Should it continue over subsequent months, then like overall net selling this would be a key warning to take under advisement.
3. Finally, in response to what’s suggested by two out of the last three months being net negative headline TIC, growing systemic dollar shortage, the official side has remained relatively muted. For July, just barely a net minus. 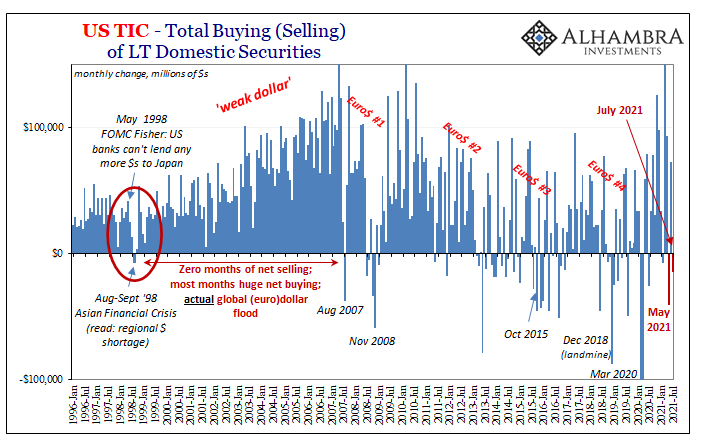
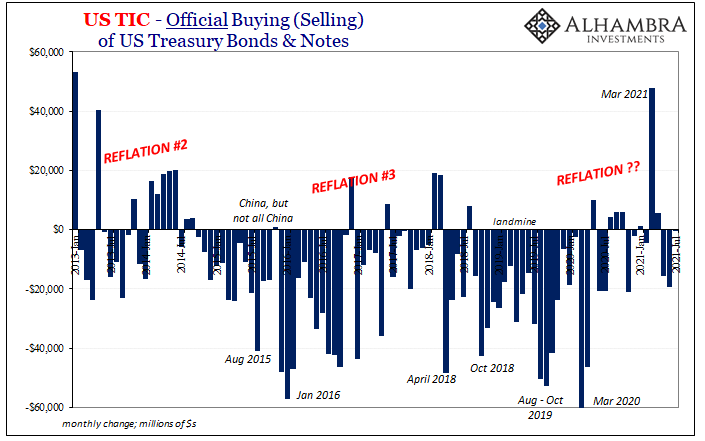
There was the one big month of net official buying – the one when UST’s were falling to their lowest recent price, the opposite of how it’s “supposed” to work by conventional views – and that big month just so happened to be also the peak in reflation.
This actually makes sense: more offshore dollars (reflation), prices for safe and liquid instruments fall (bond rout), overseas officials are able to add more US$ assets to their reserves even as they lose value.
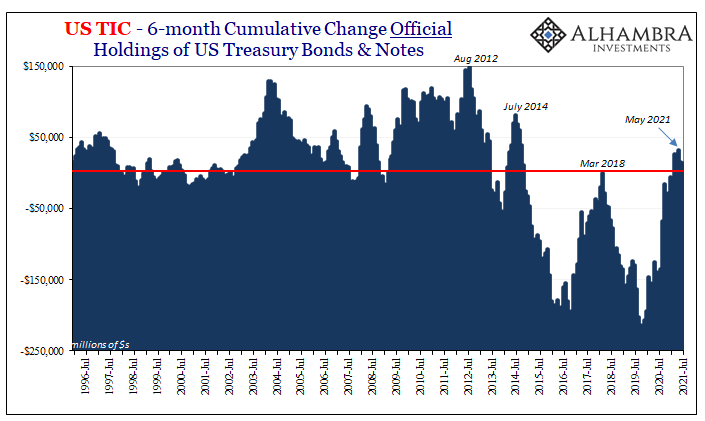
Then comes the (inevitable?) opposite: UST’s begin to rise in price yet foreign reserve managers sell them as a means to offset the reason for the falling yields that come with rising bonds – dollar shortage as higher deflationary potential, therefore lower growth/inflation expectations which, since 2012, has forced officials (not just Chinese) to deal with the monetary shortage by mobilizing reserves.
They don’t just “sell Treasuries”, though, many appealing to the purposefully hidden use of “contingent liabilities.” Thus, when TIC shows foreign official net selling of UST’s, the main reserve asset, it indicates dollar shortage though to a degree which isn’t likely described only by that selling.
We know by this visible behavior central banks are acting in response to a eurodollar shortfall because we can see it here, but what else are they doing at the same time? Almost always there’s more to it.
In our current case, the July 2021 TIC estimates, the pendulum has swung back in the other direction from reflationary monetary relaxation back toward shortage. Basically, consistent with everything else we find in this data as well as market prices, etc., even if we don’t know the full extent of what’s being done about it.
Deflationary potential up.
Caveats: the TIC data, broadly speaking, is incredibly helpful and informative as one of the few sources for cross border flows even if it was never intended to be used in this fashion. However, what’s missing from it is a third piece which remains completely absent.
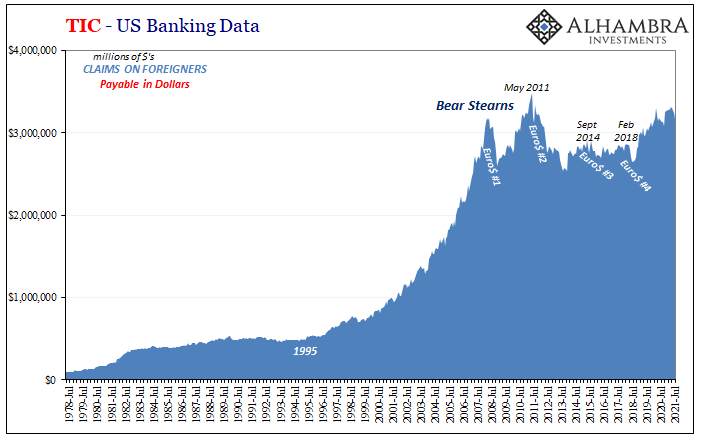
What I mean is, TIC captures bank data and asset flows from the US to outside, as well as from outside into the US. The banking data is broken down specifically into those two categories from the perspective of US banks (and this technical term also includes domestic subsidiaries of foreign parents).
The first is what I call and color the blue: US banks who lend to (claims on) overseas counterparties. And then the red: US banks who borrow from (payable to) overseas counterparties. This lending/borrowing data in both directions also includes a small window into securities lending; the lending/borrowing of securities either explicitly held in repo or for use in other ways that eventually lead back to collateral in repo/derivatives (transformation).
What TIC does not capture or even go after – because it cannot – is the vast likely larger piece of offshore to offshore. It does get some US to overseas, and then some overseas to US, but there is nothing, absolutely nothing (even the best BIS data is wildly incomplete) about overseas to overseas.
You get a bank in the US doing something with a bank or non-bank in the Caymans, some of it (not all) shows up on TIC. That bank in the Caymans doing something, in dollars, with a bank in Singapore? Ghost.
This can account for most of why TIC can seem “noisy” at times and even contradictory at others. In the short run, just too many unknowns and too much left out of the data collection. In other words, why, even though this is all really good stuff, better than most, we still have to be careful about drawing too many individual conclusions.
You can start with TIC and what might be indicated within it, but that just means there is more work to do. The chief benefit is, unlike most who don’t know or can’t read the data, which is pretty much everyone, you at least know in which direction to start looking.
Stay In Touch