
For the first time since last December, the level of Job Openings (JO) pictured by the BLS’s JOLTS survey declined. End of the line for the economy?
I am intentionally overselling this monthly minus. While the latest figure for September 2021 was indeed less than the one for August, if only because August’s estimate was raised by several hundred thousand. Going from 10.63mm (revised) to 10.43mm (latest) hardly seems worth mentioning, particularly when the previous high for the entire series was barely 7.5mm (Nov 2018).
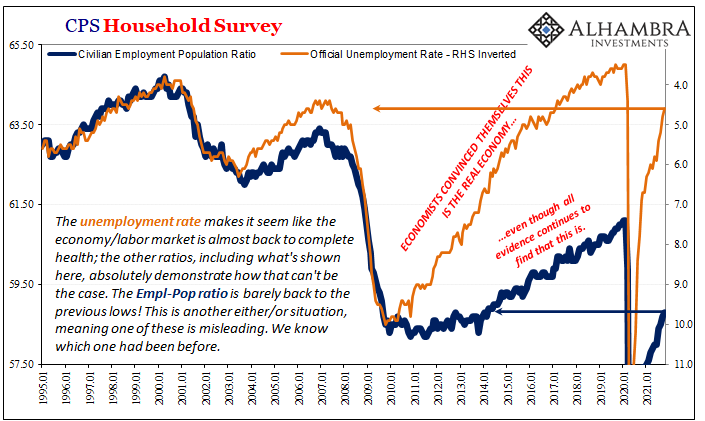
This doesn’t mean there aren’t problems here, specifically the same dichotomy across and behind these major statistics (the other being the unemployment rate). Job Openings are, also like 2018, presenting one economic possibility while other data within the same survey, JOLTS, aren’t anything like it. 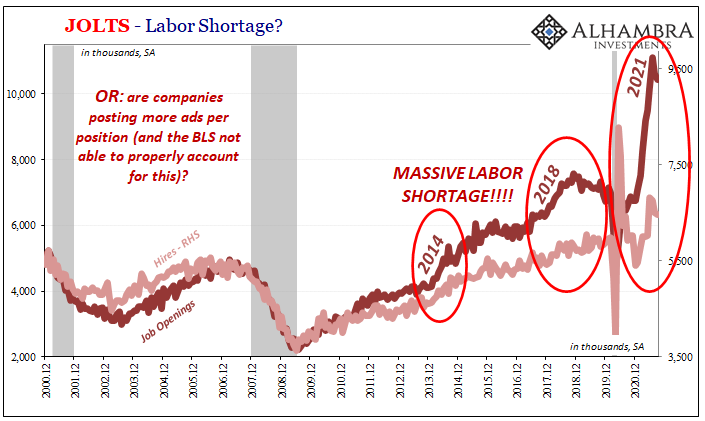
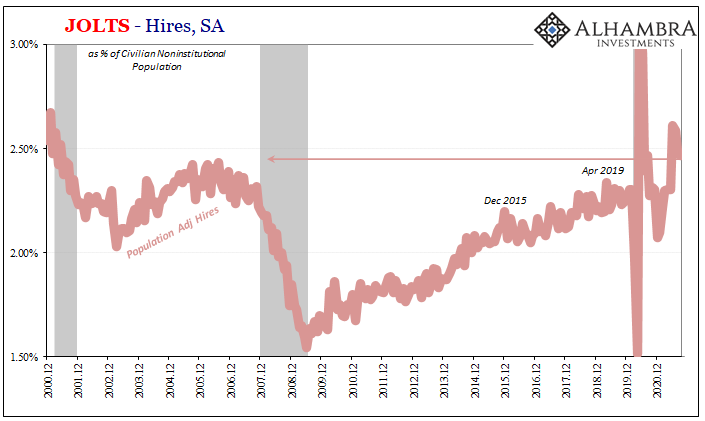
The hiring rate, or Hires (HI), remains something higher, but not so high you’d think the economy was on fire. On the contrary, boosted by further reopening (from the last of delta corona) the number of HI for September was only 6.46mm, down for the third straight month from 6.83mm in June (keep this downward trend in mind).
On a more appropriate population-adjusted basis (above), the rate of hiring in September was no better than the middle 2000’s; hardly the kind of labor market anyone might associate with inflation (if anyone would so rely on the Phillips Curve for that kind of thing).
This is where the “lazy” American narrative falls in – and then flat on its face. JO presumes epic levels of demand for labor, therefore the relatively low rate of HI must be because of all those taxpayer-funded vacations made possible by the overly generous Uncle of each of these millions supposedly ill-minded toward working.
Or maybe they aren’t slothful, just having been “stuck” with children to babysit.
But we know in September (and October) that the anticipated rush of workers back to work didn’t happen regardless of excuses. The labor force itself declined by a few hundred thousand in that first month and only brought back half the following. These two months the same as when their Uncle’s generosity disappeared in huge chunks as well as almost complete and total reopening of schools.
OK, if not laziness then how about the boom in jobs itself?
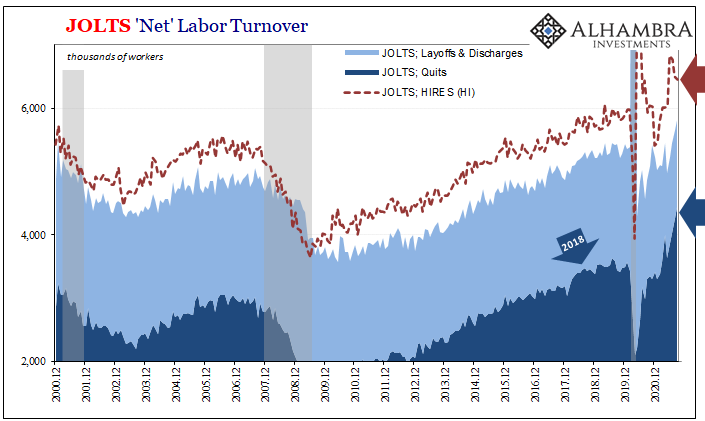
After all, more JOLTS, the number of Americans who are quitting has skyrocketed, too. Things are so good for these workers they can turn themselves over in the labor market before their own companies have a chance to truly compete.
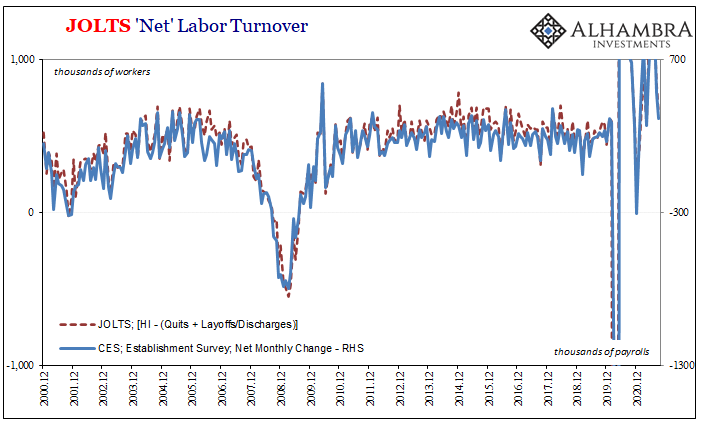
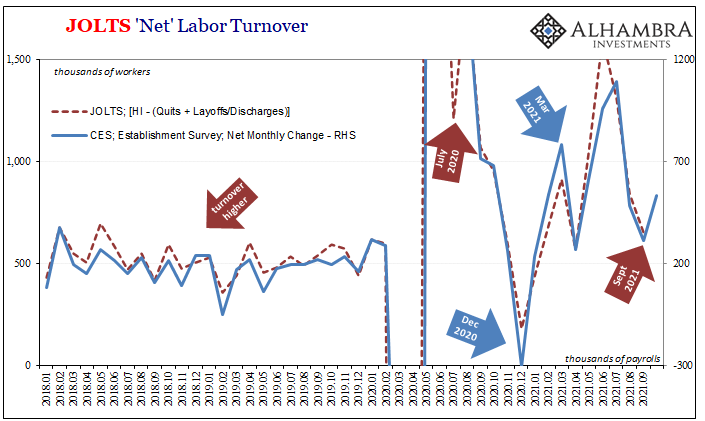
By virtue of the turnover data, the key reason why the August and September employment reports “disappointed” (even after being revised upward) was – outwardly – because of so many quitters. The net for the month of September was a spot-on match with the (revised) Establishment Survey: +312k for headline payrolls, and +650k minus 300k adjustment for the net turnover (above).
So, while the data for turnover adds up, the whole macro picture certainly does not. If all these Americans are quitting because they feel like they can, and would easily find a much better job at much higher pay, and if we take JO as anywhere close to realistic, then why wasn’t the HI part of turnover so, so much higher?
If employees are quitting to go to a better job, creating more turnover, then where are all the other employees who should be employed to replace them in addition to all the millions companies supposedly are desperate to add? This should have meant at least an equal if not so much better number of HI, which, remember, is falling since June, for a given Quits, still rising.
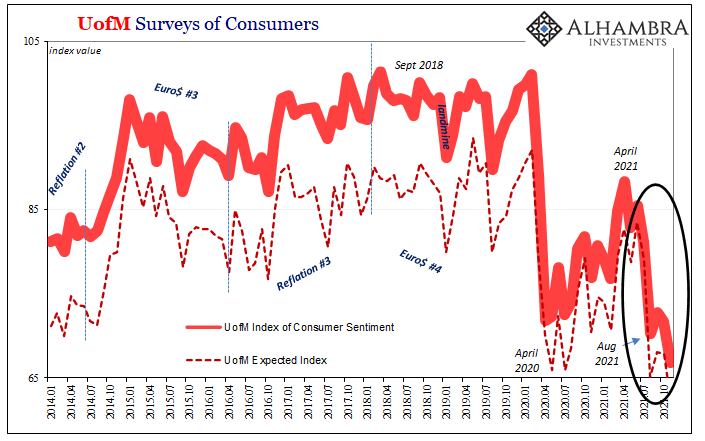
To add even more fuel to this mysteriously cooling fire, today the University of Michigan released its initial estimates for November 2021 consumer confidence. Just awful, more so than in the past few months when UofM’s numbers were worse than 2020’s worst.
The overall index dropped to a new multi-year low, 66.8 from 71.7 in October, while the expected or future index all the way down to 62.8 from 67.8 (and right off the chart below).
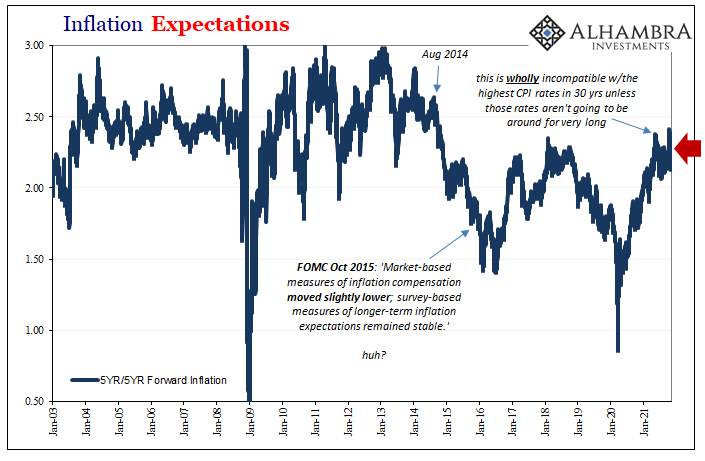
Not only that, even after so many five-plus percent CPI’s in a row (the surveys were conducted before this week’s release of October’s six-plus percent, but these consumers being surveyed don’t need the BLS to tell them what gasoline or food prices have done lately) one-year inflation expectations remained elevated, but only slightly more than in October (4.9% vs. 4.8%).
Even more revealing, the expected five-year change was still just 2.9% – despite the apparent re-accelerating consumer bucket recently.
These confidence numbers, along with others and then bond yields, these are not what you’d find if the labor market was so good it was filling workers (who are consumers) with so much confidence they are quitting their jobs in record numbers. These are instead the levels much more consistent with an economy doing something else, especially for a probably-too-large proportion of the potential labor market left out and behind.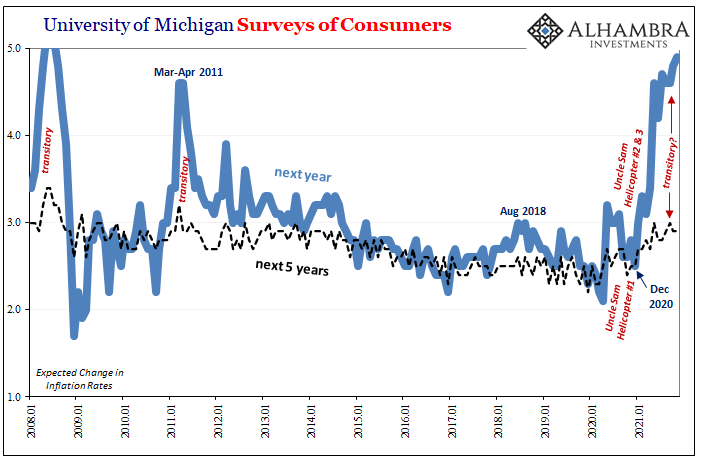
Undoubtedly, gasoline and food prices are one part of these tanking confidence numbers. When filling up your SUV steals so much from your discretionary budget, you aren’t going to feel very good about now or the future.
However, consumer confidence didn’t really drop until August – meaning, it remained OK for the first four months of the “inflation” spike. It was only recently that things turned off the deep end – the same time when the labor data turned if less dramatically.
And by labor data I don’t just mean a couple of reduced payroll reports, rather the rest of what’s available which includes what the Department of Labor says about the situation among the non-employed.
Unemployment Insurance claims.
Might this instead be a bigger part of the really alarming rate of alarm consumers must be seeing?
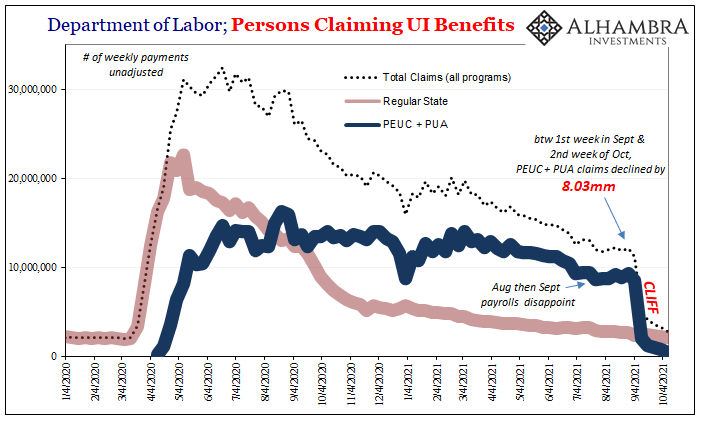
Before getting to the most obvious part of the chart above, first notice, too, how total UI claims being paid actually rose right around the end of July – already suggesting “something”, maybe even weakening, was going on exactly coincident to all this other stuff in JOLTS (and the BLS HH Survey) apart from JO.
After that, of course, the cliff. More than eight million Americans lost payments over a five-week span September to October. Even if the labor market were as awesome as everyone said, this would still be a hard pill for it to swallow all at once. What if the labor market was only so-so? What if only so-so and then kind-of wobbly?
Combined, gasoline is bad enough then comes the unemployment cliff and how consumers feel about the economy necessarily drops through the floor especially if for all the noise about the labor shortage companies aren’t actually doing much about it.
The final piece is what isn’t mitigating this serious situation – the hiring. HI did not come anywhere near absorbing the quitters let alone the cliff-ers. And that’s where this comes in to really discolor JO’s sunniness:
In the United States, sawmills are facing a labor shortage as workers are unwilling to work in such dangerous conditions at low wages.
You can advertise for as many job openings as humanly possible, but if you aren’t really willing to pay then the former doesn’t actually say much about the real state of the economy whereas the latter is everything.
No one, and I mean no one, seems willing to talk about this nor particularly the unemployment cliff. Why is it that in the mainstream CPI’s seem set up for red hot for years to come like it is 1966 again, but nowhere else? Even JO would be quite obviously misleading if the situation described for American sawmills applies more broadly to most or enough of American labor.
The data keeps adding up for the latter as if it’s not just lumber companies being shy where it counts (their commitments to costs). And I certainly believe that’s why the upside-down inflation expectations both consumer as well as bonds.
The “inflation” like the current mirage of a recovery just doesn’t pass the math.
Stay In Touch