
Though labor data, like the market it measures, is a lagging macro indicator, there’s some use in closely tracking any changes to it. Financial markets may send out profound warning signals, as they are now, about the future which aren’t (yet) showing up in the employment statistics, still those estimates might provide at least some background behind in this case deepening curve inversions.
That is to say, if the latter are recession warnings you aren’t going to find anything of the sort in today’s JOLTS and probably not in Friday’s payroll numbers (for March).
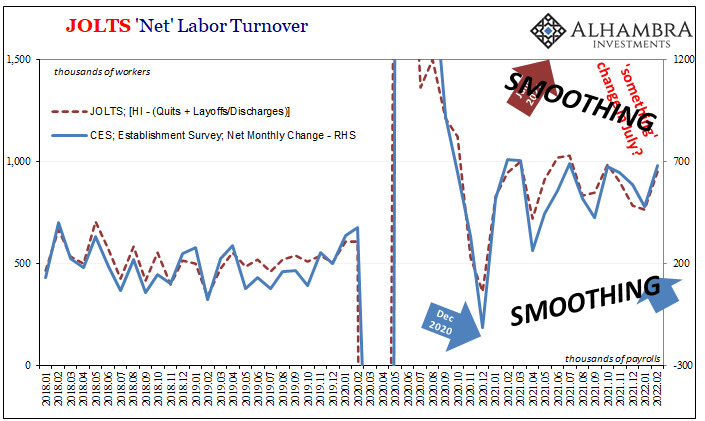
As to turnover, JOLTS, the calculations have been rendered rather mundane by the redrawing of the Establishment Survey then feeding into particularly JOLTS Hires. Each was smoothed, to put it mildly, which simply means that unless some monthly data point comes out different everything must be the same – which isn’t necessarily a good outcome.
For the February 2022 estimates, nothing in the entire series suggests anything had changed whatsoever. Everything about these estimates remains committed to each’s prior course.
And that is how all the three major JOLTS components – Job Openings (JO), Hires (HI), and Quits – represent inconsistencies to which the statistical smoothing only added more.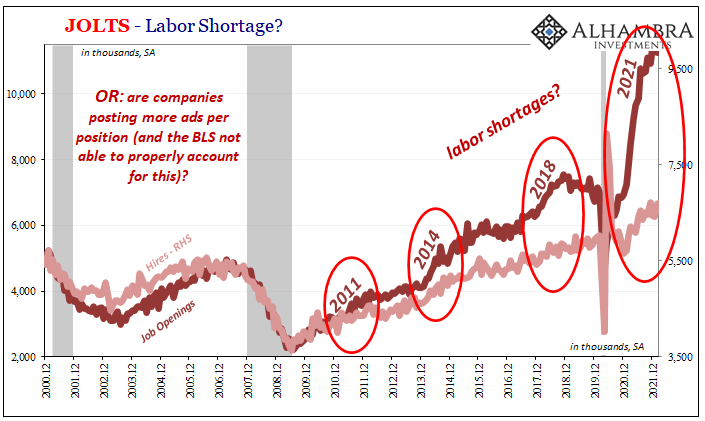
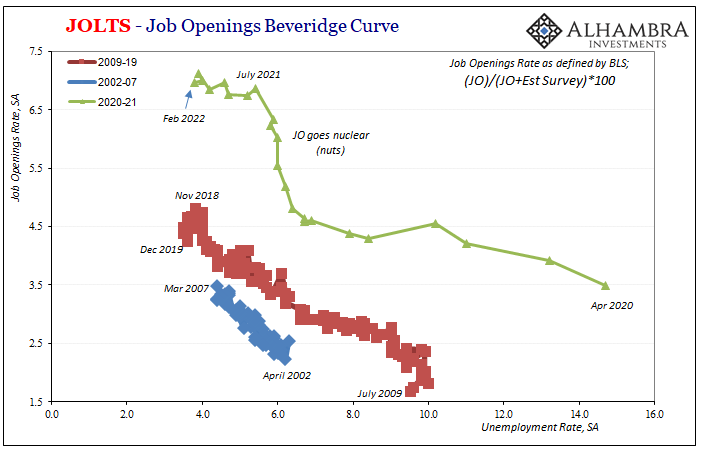
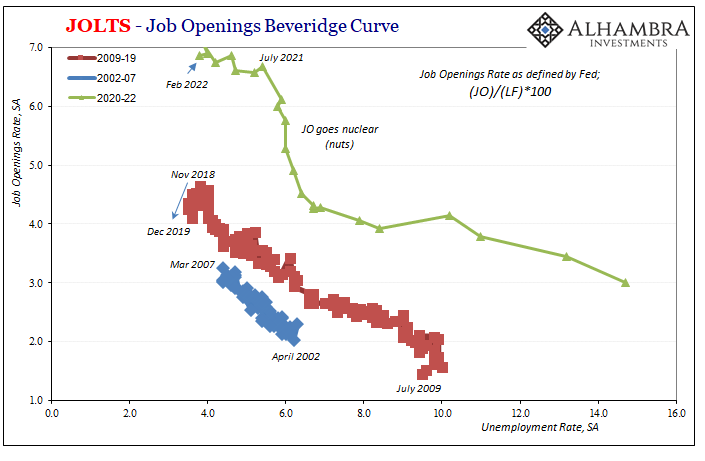
The first of the trio, JO still in the stratosphere above 11mm which at this point doesn’t point to a labor shortage so much as what can only be a statistical no man’s land. Whether in comparison to HI, or converted into its own outlier Beveridge Curve, the JO data is at this point just out there in a way that makes even the unemployment rate blush.
There just aren’t any serious correlations to it when there should be several; the more it remains this way, the longer it might take for something to converge with it, the more you know there’s likely a statistical or survey problem (my view’s the latter).
What about HI? According to the redrawn estimates, hiring activity accelerated across the latter half of 2021 just as everything else was slowing down. Maybe that’s the typical lag, or maybe the data was simply attached to the CES benchmarks a little too closely. 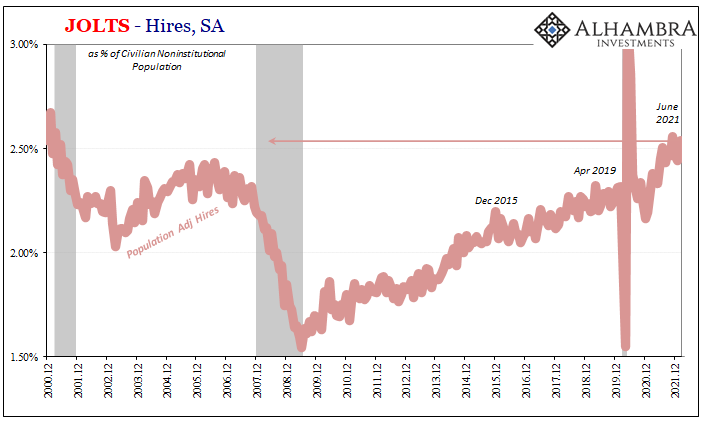
Whatever the answer, even at these elevated levels, they aren’t actually elevated all that highly when compared to either JO or even history (adjusted for population). On the contrary, the HI rate is rather sluggish given the different implication drawn from those payroll numbers plotting the pace.
Doing the JOLTS math for February, the turnover [HI-(Q+LO)] ends up being 951,000. Subtract the statistical remainder (300,000) and it nets to 651,000 compared to the CES payroll change of 678,000 for the same month.
While the BLS undoubtedly will argue that making these two the same is kind of their point, shouldn’t we question how it took such massive revisions to do so? Questions that for February continue to go unanswered (for the second straight month, I’ve included the pre-2022 benchmark turnover calculations to illustrate just how much they’d been altered).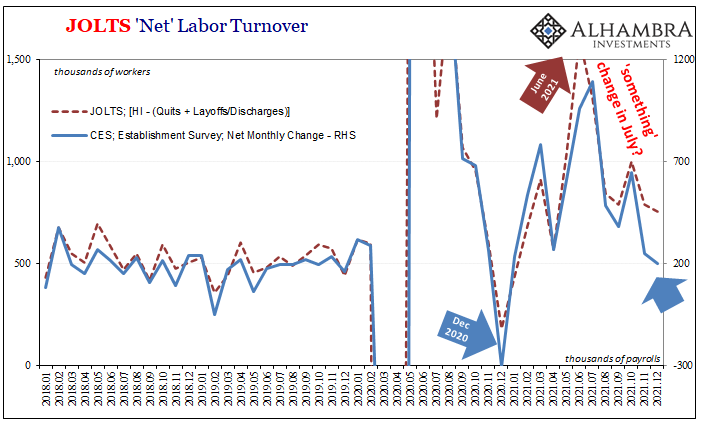
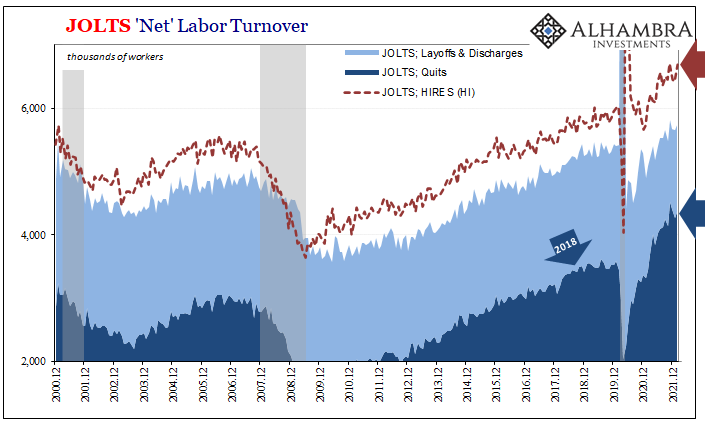
For Quits, all goes the same. The so-called Great Resignation also appears unwilling to slow down. According to the BLS, the monthly rate of voluntary separation last month ended up as 4.35mm, just shy of November and December’s figures therefore the third highest on record.
As the other two JOLTS series, this one leaves us with a binary: either there really is a wave of resignations for YOLO reasons, or quitting reflects something else like the rather disturbing, unchanging distance between HI and JO. Companies say they are desperate, yet they’re holding back and workers are telling you why.
Companies aren’t hiring at the rate the economy needs because they won’t commit to the market-clearing wage. The economy never once recovered sufficiently following the Great “Recession” and is now repeating the same downside process despite those lofty labor numbers more to do with pandemic reopening than actual, legitimate “booming.”
Prosperity? We’re nowhere close and thus Jay Powell is yet again, for the second straight time, about to commit to rate hikes for all the wrong reasons.
When you dive into the JOLTS data, it actually does make that same case even though at first glance it might seem instead to perfectly demonstrate the labor shortage theory. Yet, if it did, perfectly, then we wouldn’t find all these ongoing questions and inconsistencies.
This isn’t some unsolvable mystery like Newton’s Three Body problem, either, rather that there are and continues to be these same inconsistencies month after month offers us a hostile clue. One of these really should stop doing the same thing, break out of its current trend and start to correlate more closely with…something else consistent with what the FOMC is saying. Not doing this pushes/keeps the labor data in the same overall category as 2018’s.
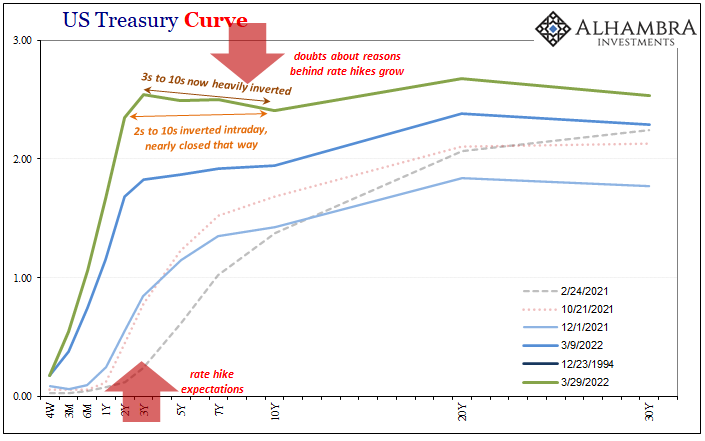
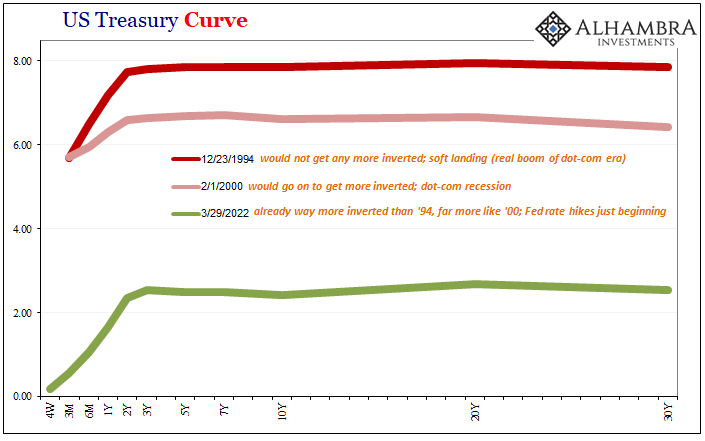
Inversion spreads again, this time the "big one."
— Jeffrey P. Snider (@JeffSnider_AIP) March 29, 2022
2-year/10-year just crossed intraday. Like before, may not stick into the close but it will over the coming days.
Please explain this one, Mr. Powell.
Even the normally friendly bank Economists are running for cover. pic.twitter.com/Q5dlspL4K1
I believe that’s the general inversion case across the bond market; that the economy experienced some reopening momentum which waned (even if not yet apparent in labor) leaving it exposed to its own underlying if hidden weaknesses. Chief among those, the market-clearing wage issue which comes down to an unwillingness on the part of companies to hire at the rates labor truly demands.
This points to a macro condition that is much weaker than otherwise thought or appears, and the system as a whole would be far more susceptible for generalized slowing to become more than any run-of-the-mill downturn (like, say, 1995-96). And that, in a nutshell, is the big inversions.
Job openings may be sky-high at least in the estimated form, yet so, too, are quitters. In between, hiring just matches the intentional straight-line course plotted by the BLS from its CES figures. Each continues to point to different things when the FOMC really should require the same from all three.
Not that the Fed ever needs to a reason to do whatever it was going to do anyway.
Stay In Touch