

It appears we have started the third correction in stocks since the bottom in October of last year. The first one was in December and saw the S&P 500 fall about 8% from peak to trough. The second one was from February into mid-March and totaled about 9%. I don’t know how far this one might carry but a pullback to the 50-day MA seems a reasonable first target and would be a 5-6% correction.
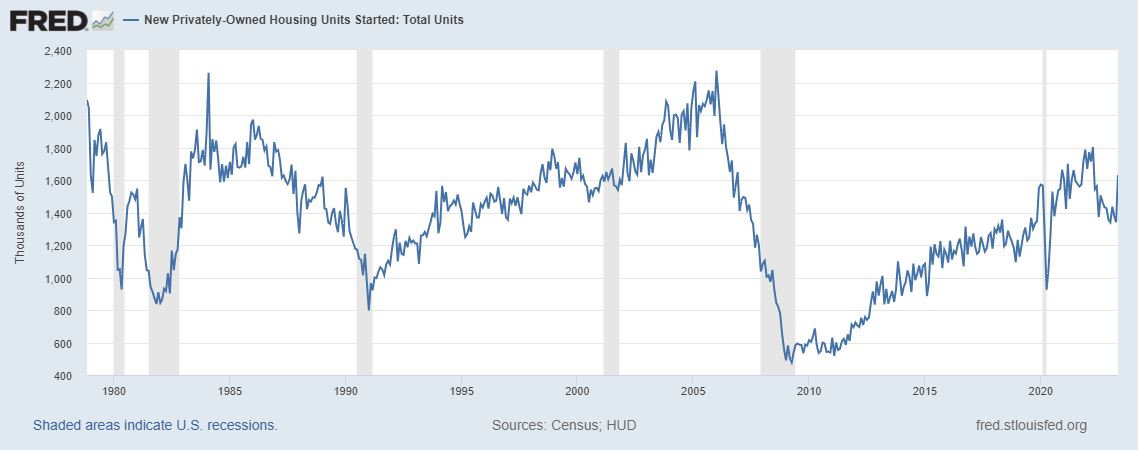
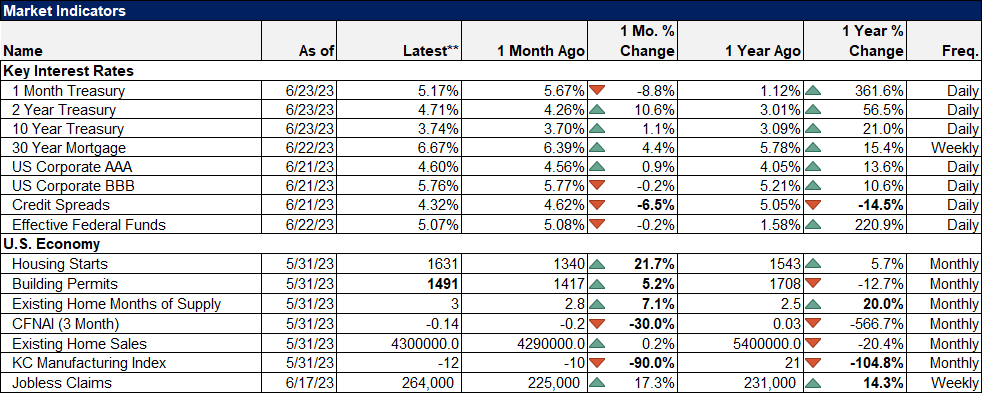
The catalyst for this correction has been the realization that there is not a lot of reason right now to expect interest rates to fall. If anything, the impetus is in the other direction as the economy isn’t responding to the Fed’s attempts to slow activity. The housing data last week was interpreted as quite strong and on the surface it was, with housing starts up over 21%. Lost in the shuffle was the fact that even after a big jump, starts are still quite a bit below the peak for this cycle in April of last year.
It does look as if housing investment will add to GDP this quarter for the first time in 2 years but I think there are some signs pointing to a peak in activity soon. You can go read my other commentary for more details but I would add market sentiment to the list. Homebuilder stocks tend to lead the US housing market index (HMI, which is essentially a homebuilder sentiment index) by a few months and this time was no exception. Homebuilder stocks bottomed last June while the HMI didn’t bottom until December (a report that wasn’t released until late January).
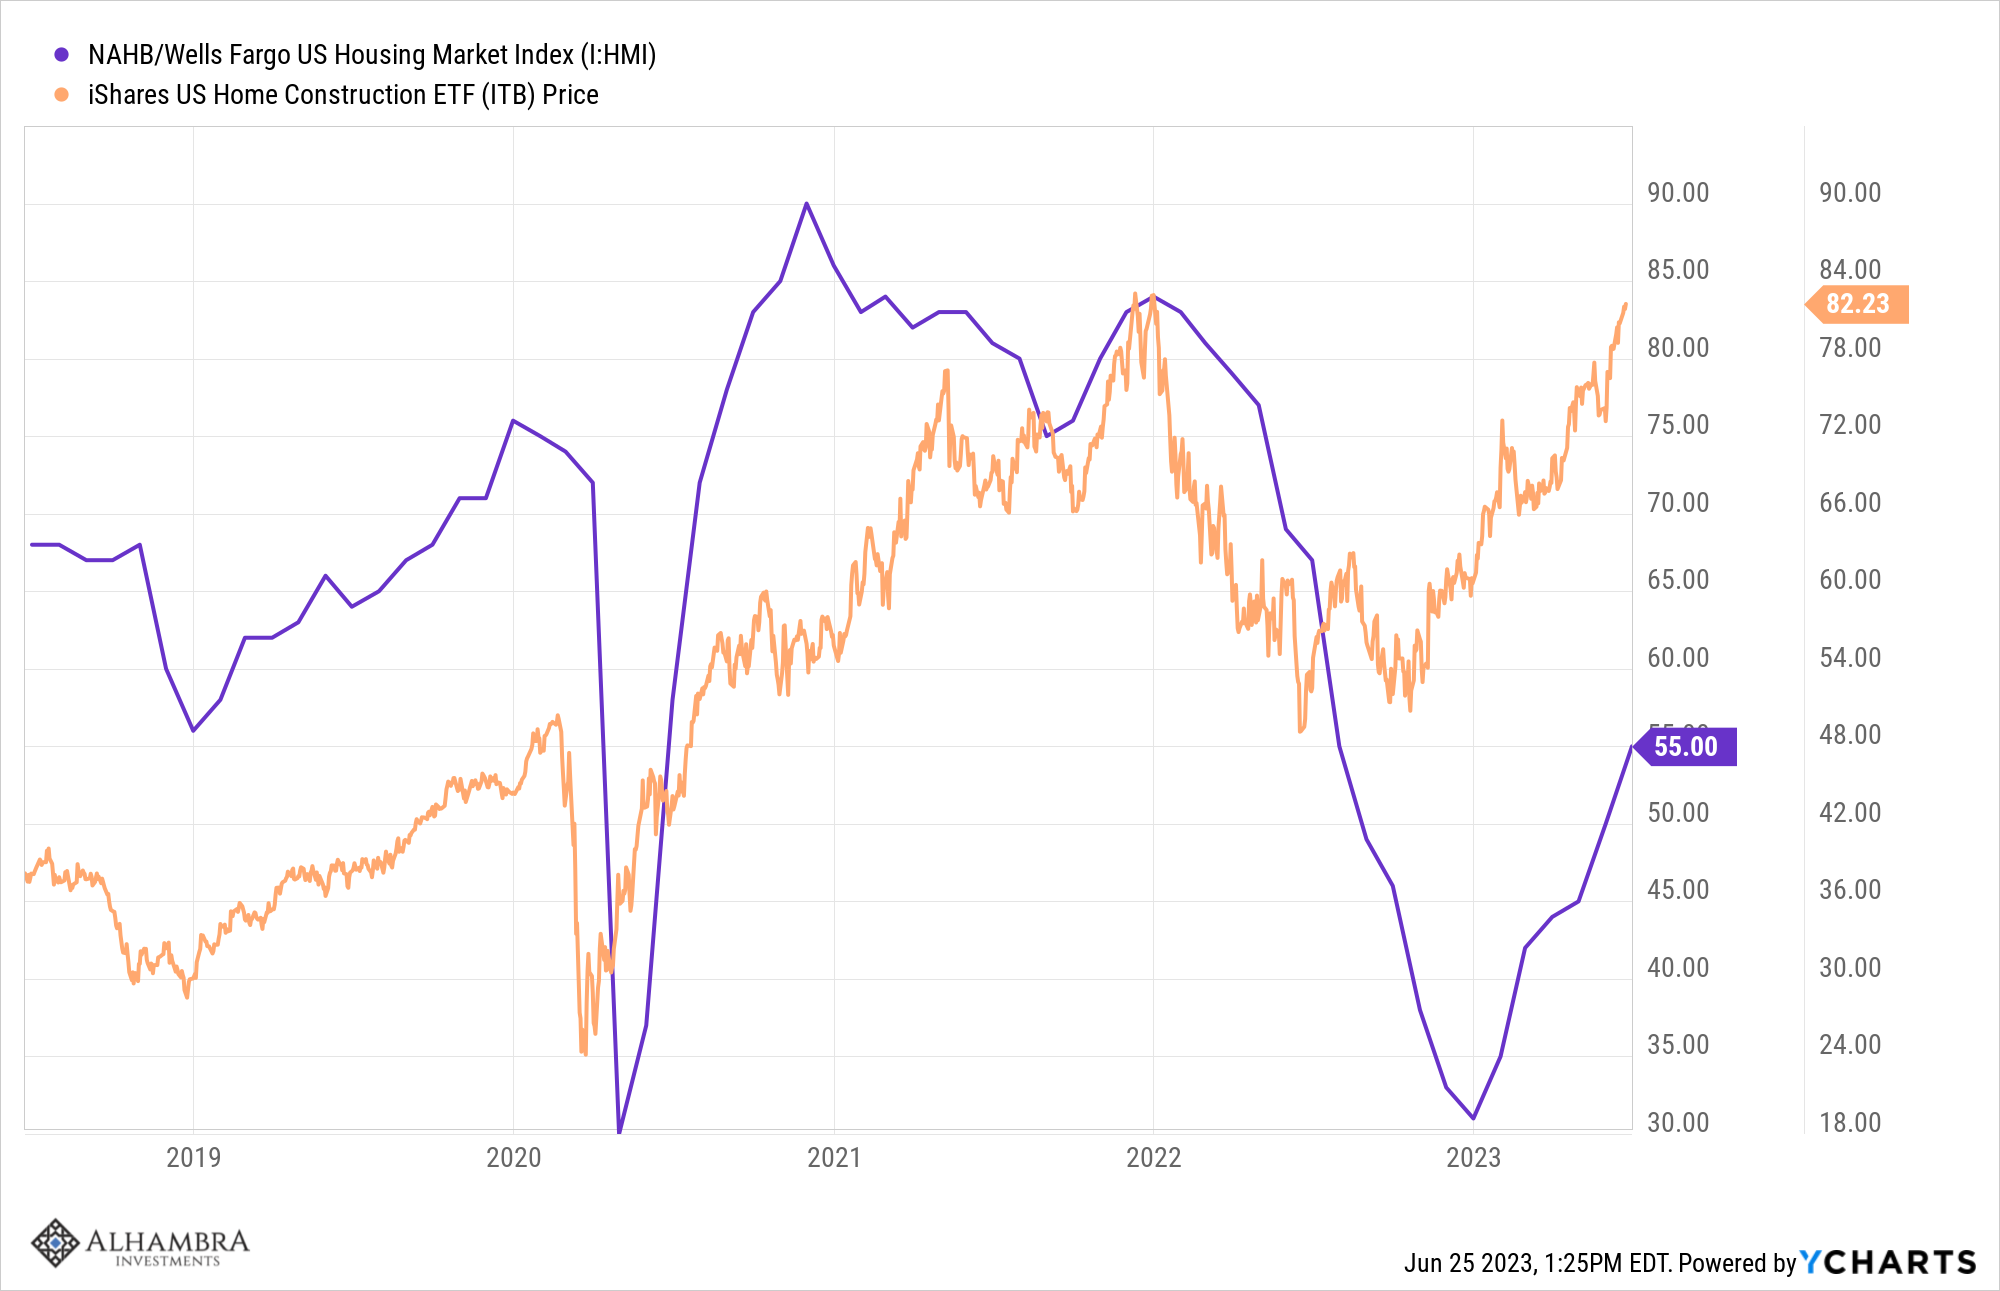
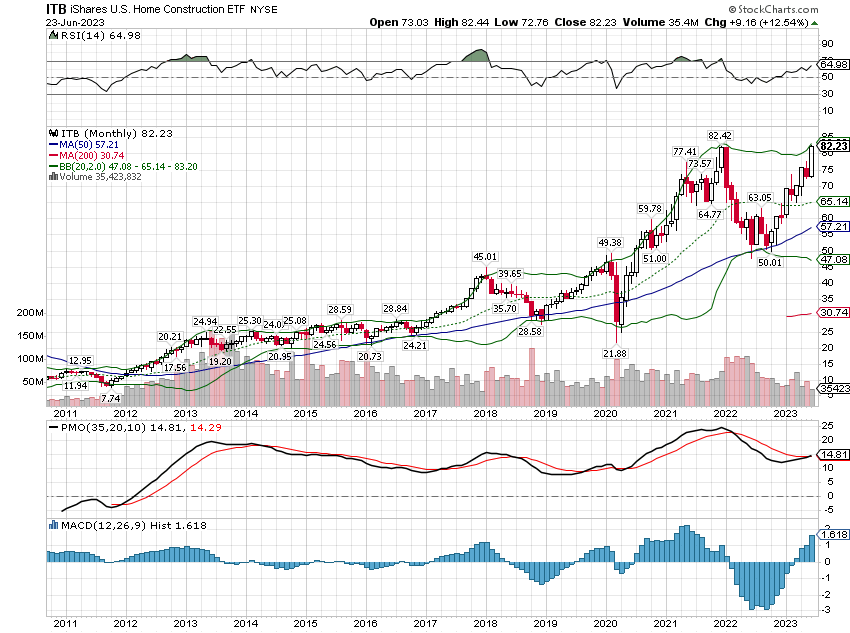
The HMI is now trending higher and the report for June was released last week, another gain to 55. And, in response, the homebuilder stocks made a new high for this move. The problem is that everyone already knows about it and the coverage in the financial press has been pervasive to the point of annoyance; you couldn’t turn on CNBC last week without someone opining about the virtues of homebuilders. This is reflected in the technical picture which shows the stocks a couple of standard deviations above the trend.
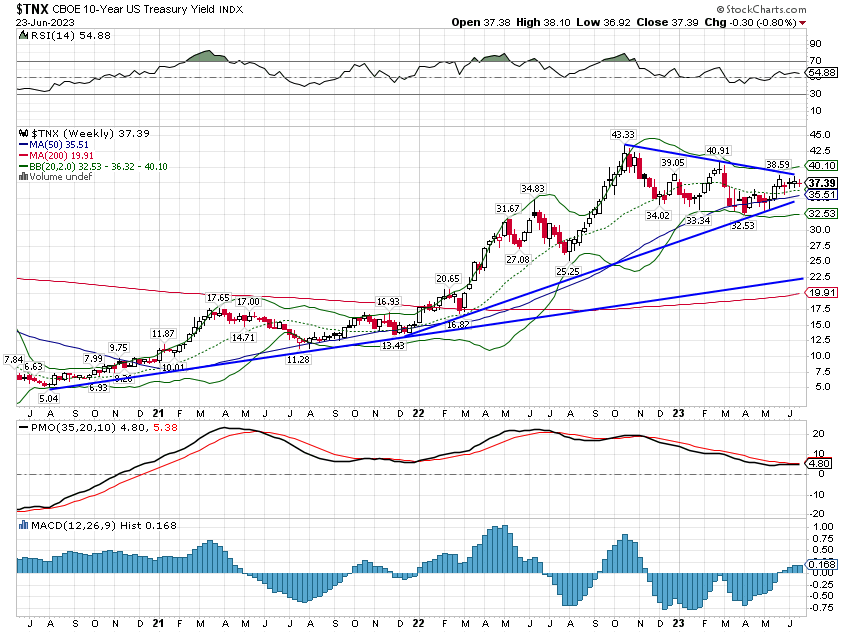
What might trigger a pullback (or more) in these stocks? Another round of rising interest rates would seem the logical choice even though rates haven’t had much impact yet. Builders have been able to offset some of the rate rise to date by cutting prices and buying down mortgage rates. But at some point, they won’t be able to offset the rising cost of buying. And with a near-record number of housing units under construction, a slowdown in sales is not what the industry needs right now. And the 10-year Treasury yield looks ripe for a breakout to the upside (see below).
Environment
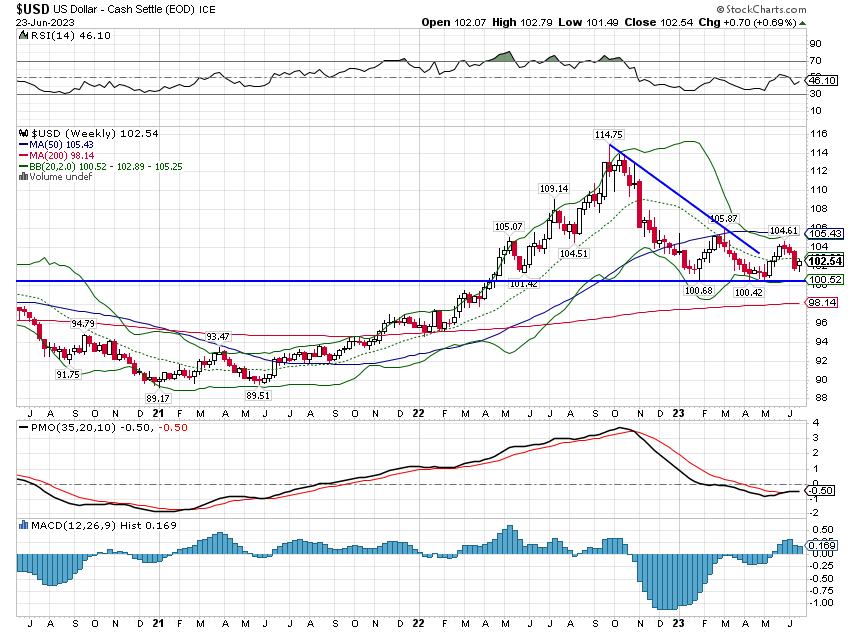
The dollar bounced late last week but continues to trade in the downsloping channel that has been in place since the peak in October.
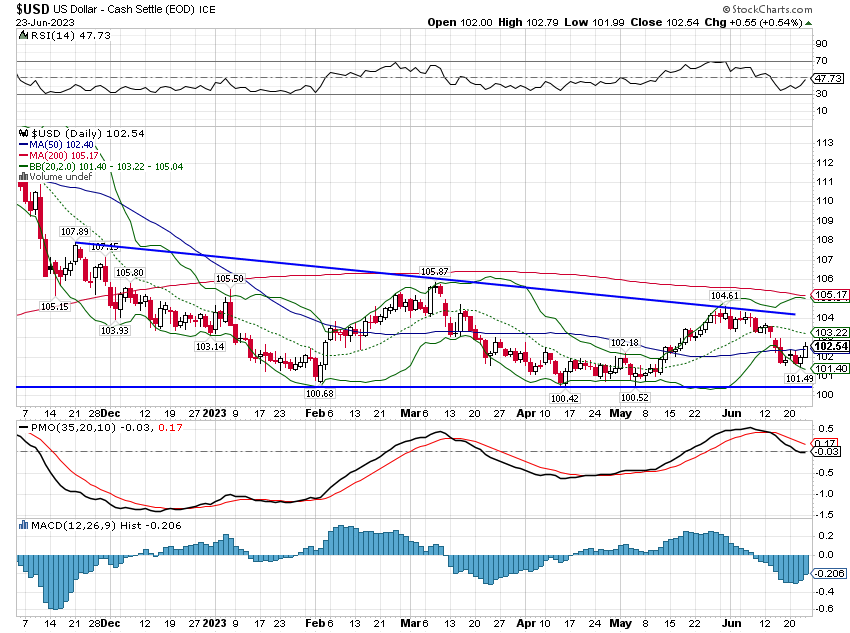
While I lean toward a lower dollar outcome in the next few years, I can’t let that bias affect my view of the present. It is important to remember that the intermediate-term trend for the dollar is still up. With the US economy’s continued resilience and worries about Europe multiplying, we may be in for another round of dollar strength.
Currencies tend to move based on changes in expected growth between currency areas and this is most easily reflected in real interest rates. In the US, with the Fed Funds rate at 5% and YOY inflation at 4.1%, real rates are solidly positive. In Europe, where inflation hasn’t come down as quickly, real rates are still negative. The rate of change points to a higher dollar, at least for now.
The 10-year Treasury yield was down slightly last week and the trend remains neutral, a trendless trend. But like the dollar, the intermediate-term trend is obviously up and that hasn’t changed either. A break to the upside is looking more and more likely. The Fed has indicated that they intend to raise the Fed Funds rate again at the July meeting but that has only a minor effect on the 10-year yield. More important will be the economic data released over the next couple of weeks. This week we get some important markers that will impact the inflation debate including Case-Shiller, new home sales, pending home sales, and personal income and spending.
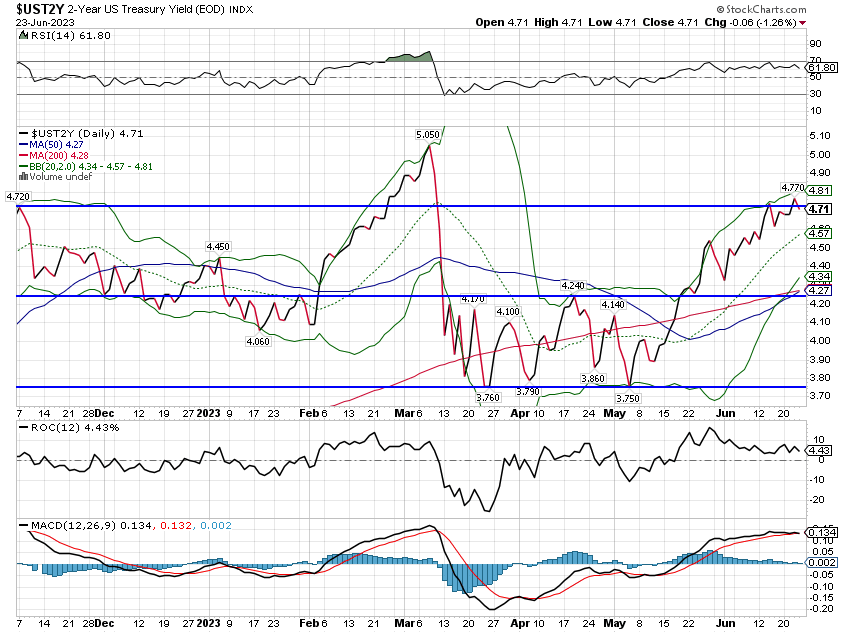
Shorter-term rates – Tbills – have continued to move higher with expectations about Fed policy. The 2-year Treasury yield is back to its October peak and appears to be setting up for another move higher as well. The economic data has been pretty consistently surprising to the upside recently and if that continues, rates are likely to resolve higher.
Markets
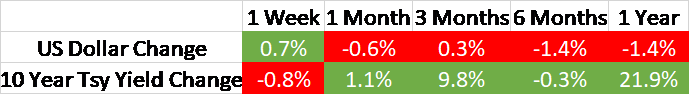
Note: The numbers below reflect returns over the last 5 trading days.
It was an everything to the downside week with real estate performing the worst of the major asset classes we follow. The sentiment on real estate is already in the extreme bearish camp. Capital Economics put out a piece recently, cited in this Bloomberg article, claiming that “values are expected to plunge 35% from the peak by the end of 2025 and take an additional 15 years or more to recover”.
I suppose they might be right if companies just continue to let productivity slip away into a work-from-home malaise. I have my doubts about that and plenty of companies are already starting to take measures to get people back in the office. Just this week, Citigroup said they have ” firm expectations for office attendance” and they aren’t the only ones. The New York Times recently had an article titled Return To Office Enters The Desperation Phase but I suspect it won’t be long before they are writing one titled Workers Who Returned To The Office Got The Promotions.
Commodities were one of the better-performing asset classes last week although still down a bit. There was actually a lot of strength under the surface with agriculture particularly strong. Natural gas had another strong week, up over 8%. The strong performers weren’t, in the end, able to overcome weak crude oil, platinum, and palladium. The key to the commodity indexes is crude oil which continues to consolidate around the $70 level. I’m still not convinced the bottom is in but we’re definitely getting closer.
Latin America continues to outperform, up over 16% for the year. That is mostly Brazil which has quietly improved its economic performance considerably. The Brazilian inflation rate is actually lower than the US by a smidge and they are running persistent trade surpluses. The Real is up nearly 10% for the year. Brazilian stocks are overbought and will probably pull back with everything else, but they deserve a look when they do.
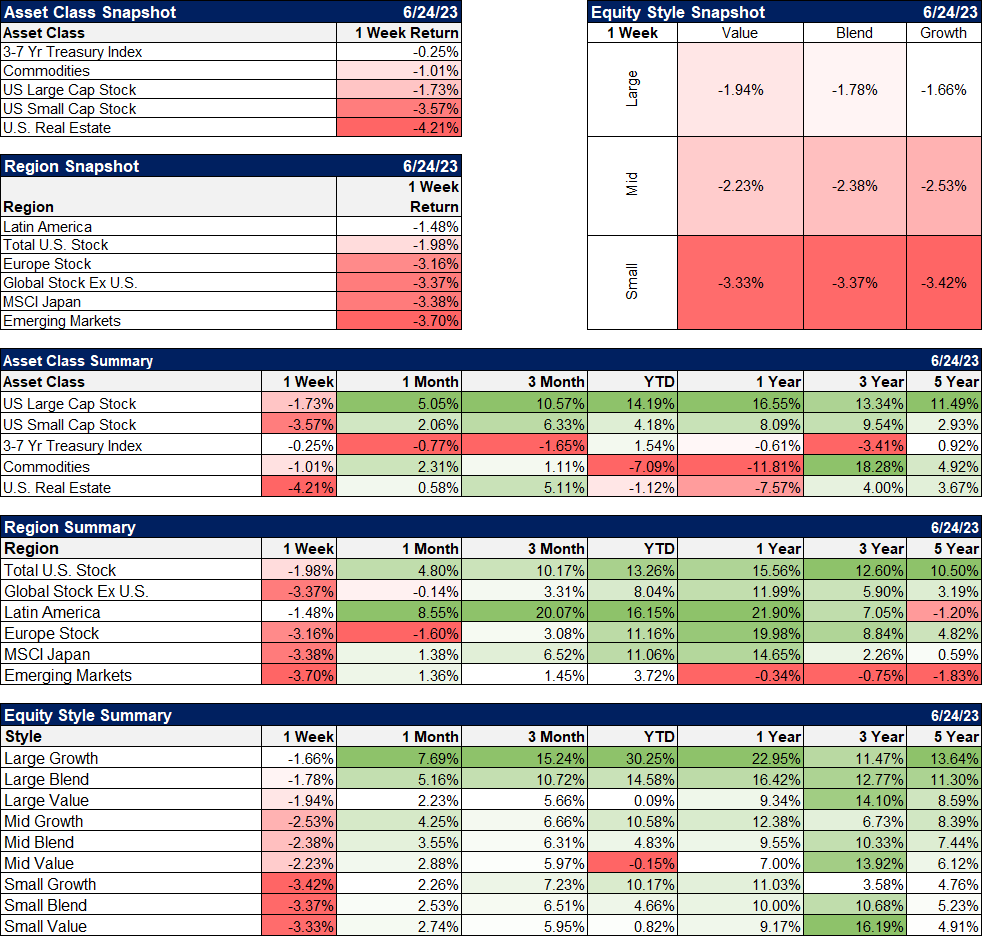
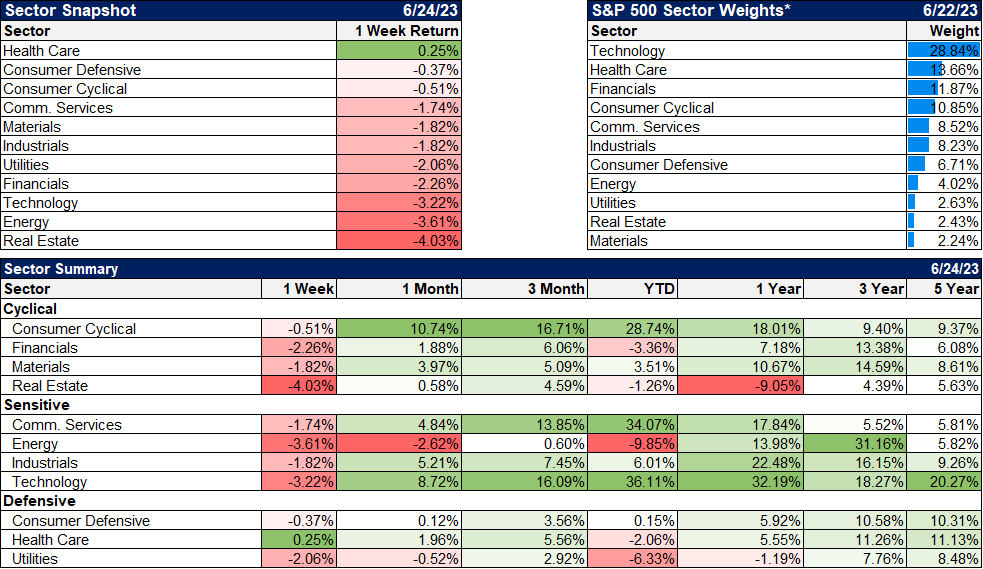
Unlike recent weeks when every sector has been positive, last week saw them all negative except for healthcare. As much as some sectors are up for the year, a small pullback shouldn’t be surprising. Technology was down over 3% last week but is still up 36% on the year. I’d be wary if interest rates do break higher though. High multiple stocks tend to be sensitive to changes in rates.
Market/Economic Indicators
The Chicago Fed National Activity index, a weighted average of 85 monthly economic indicators, was released last week, with the monthly reading down to -0.15 while the 3-month average we track rose a bit from -0.2 to -0.14. The 3-month average has been negative for 7 months in a narrow range near zero. That indicates an economy growing consistently just below trend. Readings of -0.75 or less are common during recession. This is more of a coincident indicator though so it doesn’t provide much warning.
Joe Calhoun
Stay In Touch