
When I sat down to write this week’s commentary, my intention was to write – again – about the valuation of the stock market and particularly the S&P 500. And even more specifically about the top 20 stocks, which make up 42% of the index, and trade for an average forward P/E of 27.5. It is an expensive bet on future earnings growth that is far from assured and therefore would seem to carry a lot of risk. But I’ve written that article several times over the last few years – I’m far from the only one – so it isn’t exactly news. And if it isn’t news, if everyone already knows that large-cap stocks are expensive and risky, why are they still expensive? I was taught a long time ago (in a galaxy far, far away…) that one shouldn’t worry about the things that everyone is already worried about; those things are already factored into the market.
I’ve also been doing this a long time so I know that isn’t always true. Everyone (well everyone who was sane) knew tech stocks were outrageously expensive in 2000 and many of us warned that it would end in tears, especially for the dot coms that had no revenue, no profits, and no hope of getting either. Of course, most of those who warned about that market did so for several years before the end finally came. And on Wall Street, if you’re three years early, you aren’t early, you’re wrong. Lately, I’ve started to see some claims that this market is similar to the dot com era and will face the same fate (the NASDAQ fell 75% in that 2000 to 2002 bear market).
There are some similarities between then and now but not so much in the stock market. There were a lot of companies back then with no real value and very high stock prices. But the apt comparison to today is not to stocks like Nvidia – which is a real company with real revenue and earnings – but to the crypto market. And most of the really junky stuff, the Bored Ape NFTs and other pets.com of the crypto market, has already crashed. I am still a bitcoin skeptic because I’ve yet to see a compelling use case; it always seemed like an elegant solution to…something. But the market will eventually work out what bitcoin is really worth. If we’re just looking at technology stocks, there are a few stocks with very high valuations, some of which will not fulfill their current promise and when they don’t they’ll fall a lot. But ridiculous valuations are certainly not as widespread as they were in 1999.
If large cap growth stocks are expensive and everyone knows it, does that mean that those of us who keep pointing it out are just “early”? Or is there something else going on that we’re missing? Rather than assume I’m right and everyone buying “the market” is wrong, humility – a common attribute of successful investors – requires that I question my own assumptions. Maybe stocks are trading at high valuations for good reasons. Maybe the stock market is trying to tell us something and some of us aren’t getting the message.
In thinking about what that message might be, I ran across this chart of Median Usual Weekly Real Earnings.

I find this chart interesting and surprising for a few reasons. First is that workers’ real earnings (adjusted for inflation) are rising at a pretty steep rate. Second is that those earnings have been rising since roughly 2014, something of which I think most people were unaware. Third is that after the spike and fall related to COVID, earnings resumed their pre-COVID trend; this is apparently unrelated to the COVID relief. Fourth is that weekly real earnings were stagnant for a very long time; there was essentially no gain for workers from the late 70s to 2014. Lastly, if real weekly earnings have been rising like this for nearly a decade it has to be because productivity is rising. If not, rising real wages would have either compressed corporate margins or pushed up prices and it doesn’t appear this did either. Margins have come down some from their artificial peak in 2021 but are still over 10% when the long-term average is around 7%. And inflation didn’t arrive until after COVID and is now falling rapidly; yes it appears it was transitory.
You can see the correlation between productivity growth and real weekly earnings in this chart:

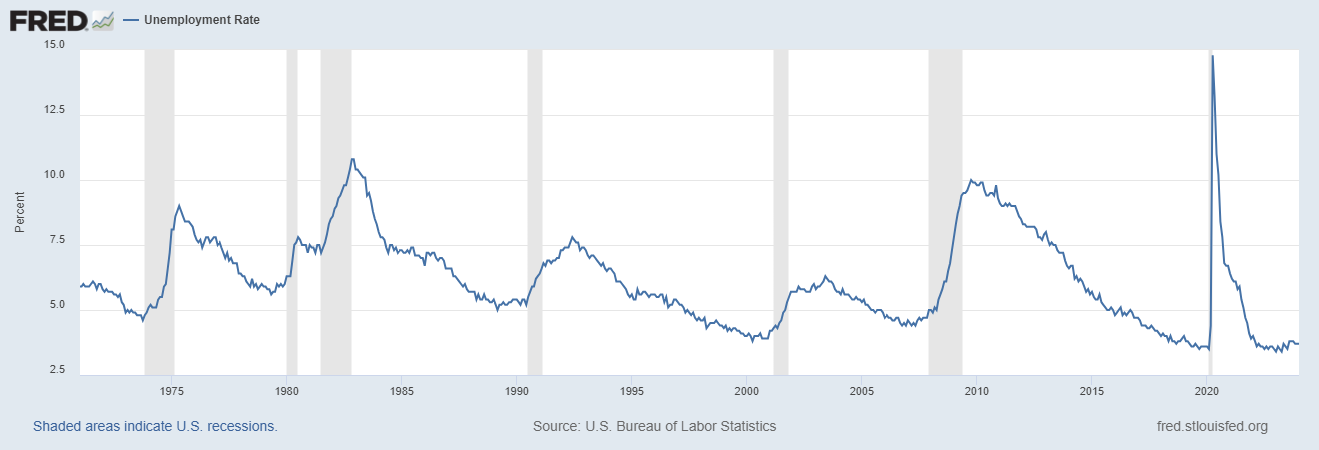
We’ve had two big surges in productivity since the 70s. The first was in the 1980s and was driven by the restructuring of the US economy. I don’t know if you remember the 80s but I chuckle when I hear people today talk about all the layoffs. The 80s was the era of restructuring and downsizing when US companies became a lot more efficient. A lot of that was driven by the LBO industry (what we today call Private Equity) with takeovers financed by Michael Milken’s junk bond shop and more was driven by fear of the LBO industry and Michael Milken’s junk bond shop. It was a tumultuous time for American workers and it isn’t surprising to see that worker pay didn’t match the gains in productivity. The unemployment rate in 1982 was nearly 11% and it did fall pretty rapidly to about 7.5% by 1984 but it was still 7% in 1986. It’s hard to raise real wages with that much slack in the labor market.
The second big surge came in the last half of the 90s and was driven by the internet. The dot com stocks have been derided as a bubble (did I call it a bubble above?) but the efficiency gains from the internet were real. Many of the companies that we ridicule today were just early. Pets.com didn’t make it but today, if you own pets, you use Chewy if for no other reason than you don’t have to tote that big bag of dog food to the car. Mark Cuban sold a company called Broadcast.com to Yahoo for nearly $6 billion dollars that was a forerunner of today’s streaming services; he just needed more bandwidth. The internet did raise productivity and it also raised weekly real earnings but productivity slid in the aftermath amidst low interest rates and a real estate bubble.
Productivity growth continued to slide until finally hitting bottom in 2015 and starting to climb again. I’m not sure the catalyst this time and it may be more than one thing but I suspect a lot of it is driven by demographics. That is about the time unemployment slipped below 5% and headed for a generational low just before COVID – and now after. There were 5.5 million job openings in late 2015, 7.6 million by the end of 2018, and today, even after dropping over the last two years, there are 9 million job openings. I wrote a paper about this a couple of years ago and speculated that without a change in immigration policy, the chronic shortage of workers would lead to higher inflation and interest rates. But I may have underestimated the productivity factor.
Economic growth is driven by workforce growth and productivity growth. If you raise both of those you’ll get more total GDP. If you hold workforce growth steady and raise productivity, you get higher GDP per capita which is what really matters for living standards. Our working-age population peaked in December of 2018 at 206.8 million and fell to 205.3 million in December of 2021 during COVID. It has since rebounded to 209.3 million, a gain of 2.5 million since the previous peak in 2018, but total nonfarm payrolls grew by 7.9 million during that same time. That’s why the unemployment rate is under 4%.
If productivity grows near the long-term average of 2% – or higher – and we are smart about immigration policy, the result would be higher economic growth. Working-age population growth last year was a mere 0.5% while productivity growth was 2.7%. The two of those together is right at the actual GDP growth of 3.1% so last year’s growth makes perfect sense even if no one predicted it in advance. If we can maintain productivity growth at the long-term average of 2.1% and increase workforce growth to the long-term average of 1% then GDP growth potential would rise to over 3%. If we get 3% productivity growth like the late 90s, growth could be a lot higher than anyone now expects.
To bring this back to the S&P 500 and stock valuations, a sustained period of higher-than-expected growth could certainly justify paying a higher multiple today. Does that mean I’m going to run out and buy the S&P 500? Well, no, because I still think the risk of the index is skewed by its concentration in tech and the very high valuations of some, if not all, of the top 20 stocks in the index. If one of the top 20 stumbles it may not make much of a difference (see Tesla, down 22% YTD) but if technology suffers a big selloff for any reason, the index is going to take a big hit with 31% of the index in that one sector. The index is expensive but that doesn’t mean that all the stocks in the index are; there are still opportunities in large-cap stocks if you are discerning in your choices.
It also seems to me that small and mid cap stocks, with most of their business domestically oriented, would benefit greatly from higher US economic growth. Those stocks as a group are much cheaper than large caps and so if higher economic growth raises earnings growth you might see their valuations expand, something that seems less likely for the S&P 500.
Is this the “right” explanation of why US large cap stocks have sustained high valuations? The point of an exercise like this isn’t to find the “truth” (which you can’t because it’s in the future) but to look at things from a different angle, to question your own analysis. The S&P 500 has been highly valued for some time and the old explanations aren’t panning out. During the post-financial crisis period, before COVID, the most common explanation for high valuations was that interest rates were essentially zero; a lower discount rate means higher valuations. Well, interest rates aren’t zero anymore and the S&P is still expensive. What’s the “right” explanation now? I don’t know. Maybe passive investing has broken the market, as some really smart hedge fund folks think but “I’m right and the market is wrong” is pretty arrogant and usually wrong.
I don’t know if productivity and economic growth will keep surprising but I do know that most people are still looking for the economy to slow, as they have for the last two years. Meanwhile, the economy and the more productive Americans who make it happen, just keep surprising everyone. With productivity already rising, another boost from AI – a very speculative assumption – could really push the economy into a higher gear. Will AI be all it’s being cracked up to be? I don’t know but the odds aren’t zero. Are you ready for the Roarin’ Twenties?
Joe Calhoun
Environment

The short-term trend of the 10-year yield is now neutral, having broken the short-term downtrend. The intermediate-term trend is still up while the long-term trend remains neutral.
The trend of the dollar hasn’t changed – short-term downtrend, long-term uptrend, really long-term trading range.
Markets
Everything written above is about the long term. In the shorter term, sentiment is now too bullish and a correction of some kind seems likely. That is consistent with the very short-term uptrend in rates and the dollar. The dollar short-term trend is still down but over the last year it is basically unchanged but over the last month it is up slightly.
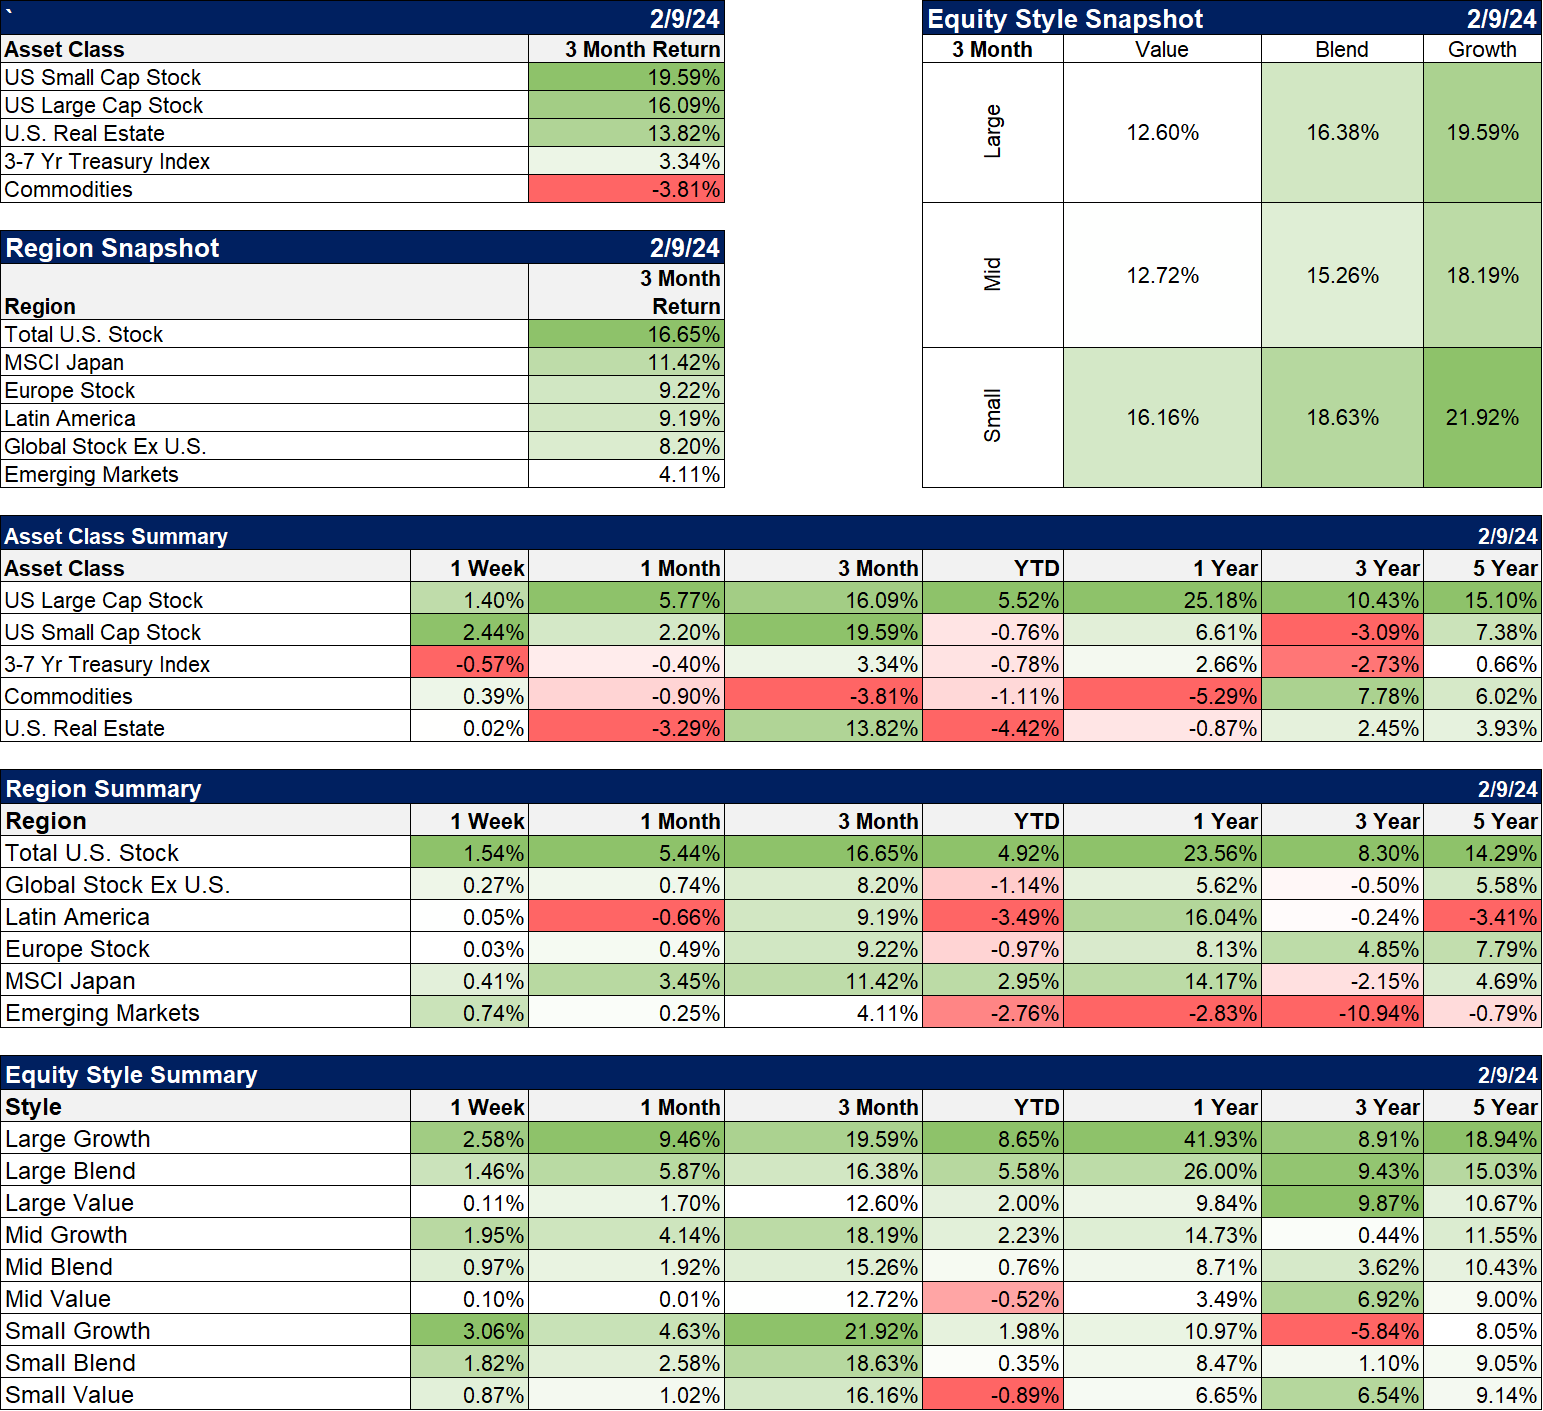
Nothing has changed in the composition of this rally either with large cap growth stocks way outpacing everything else. Japan is up on international markets although the Yen has continued to struggle making returns for US investors less appealing. The Yen is probably the most undervalued of the developed market currencies and it will eventually rise but monetary policy is still too loose for it to gain too much traction. The fundamentals of the Japanese market remain very attractive.
Sectors
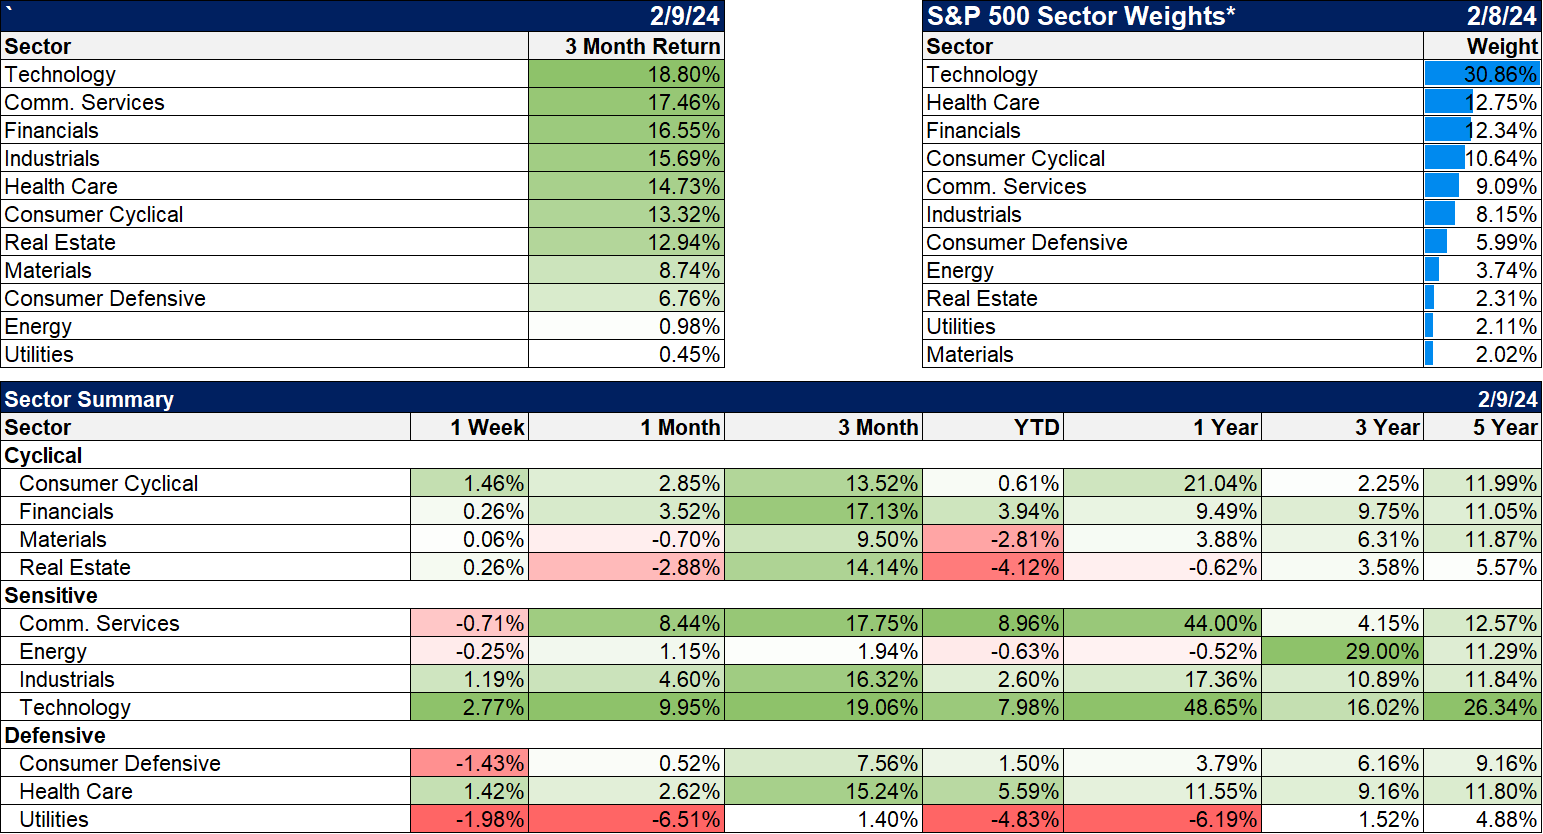
No surprises here either with technology and communication services continuing to lead.
Market Indicators/Economics
A few reports to highlight from last week:
ISM Services index rose to 53.4 in January from 50.5 in December. Unfortunately, the prices component rose to 64 from 57.4
Redbook same-store sales report was +6.1% last week versus the same week last year. The long-term average is 3.6%.
I wrote about the Logistics Managers Index here.

Stay In Touch