
This one will also be simple but doesn’t need to be lengthy. What is a flat Phillips Curve? It’s not just something Richard Clarida dreamed up recently. The idea has been talked about more and more as the inflation “puzzle” showed up disproving the LABOR SHORTAGE!!!! – meaning full employment and recovery narrative – over the past few years.
Here’s what one typical paper authored and published at the Cleveland Fed said about potential flatness in the middle of last year when bond yields “unexpectedly” dropped and the FOMC “unexpectedly” voted rate cuts where accelerating inflation was supposed to drive more hikes:
With inflation having only modestly picked up in the past few years as the economy has become more robust, many believe the Phillips curve relationship has weakened, with the curve becoming flatter.
You’ve undoubtedly spotted the flaw already. Still, let’s go through it anyway.
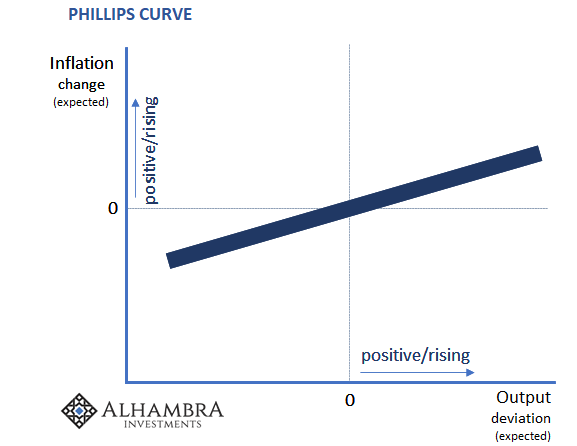
In general, because of dynamics between unemployment and wage pressures, as output is expected to rise inflation expectations are expected to rise, too. With an inflation-fighting central bank, the slope of the curve (shown above) isn’t steep. The economy would need really awesome output expectations for inflation to get out of hand.
That’s kind of like those which predominated at least in terms of the mainstream narrative since, oh, about 2017 and globally synchronized growth. But, as we’ve been discussing for the last week, the Fed’s new Grand Strategy document tacitly admitting “something” big is missing here, the inflation which had been forecast for years never showed up.
Why?
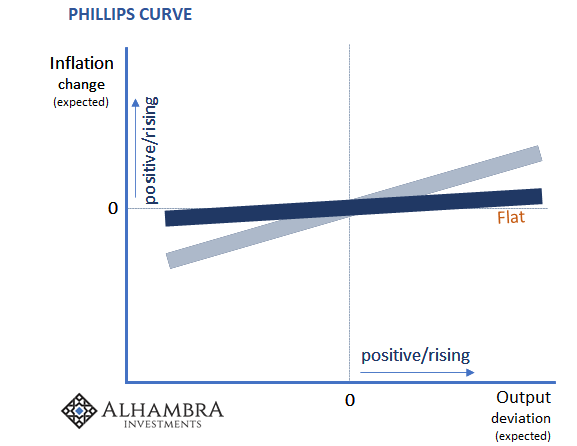
This has led central bankers and the academic Economists who follow them to wonder if the Phillips Curve might have flattened. As you can see above, with this shape even expectations for a robust economy wouldn’t necessarily create all that much for inflation (because of expectations).
The theory fits the narrative with the unsatisfactory real world results.
The question, therefore, what would have to happen in the real economy for the Phillips Curve to flatten out like this?
The answer: who cares!
You can read all the convoluted nonsense the Cleveland Fed folks came up with to try and justify this kind of curve shape. And, implied in the explanations of the nonsense, the author isn’t all that compelled by them, either.
Let’s go back instead to the original assumption:
With inflation having only modestly picked up in the past few years as the economy has become more robust, many believe the Phillips curve relationship has weakened, with the curve becoming flatter.
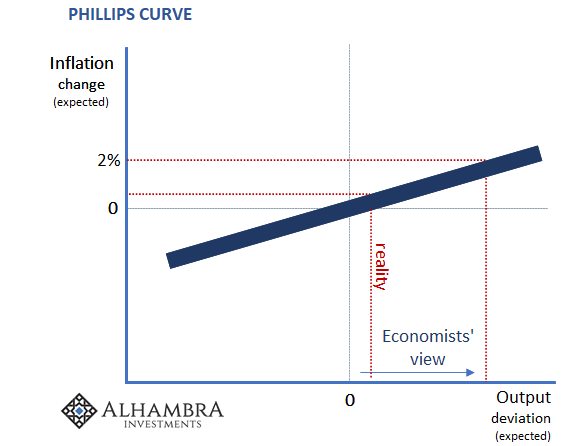
If you start by blindly accepting the premise that the “economy has become more robust” but then realize it didn’t generate the usual level of inflation, you would have to go back and reverse engineer a whole bunch of weird, absurd actions and activities to unnaturally flatten a basic Economics curve. This is, of course, backwards.
There’s no reason to do this. Instead, the curve can remain the same because the results simply challenged – and refuted – your basic assumption: what if the economy hasn’t become more robust? Then you wouldn’t need to touch the curve at all.
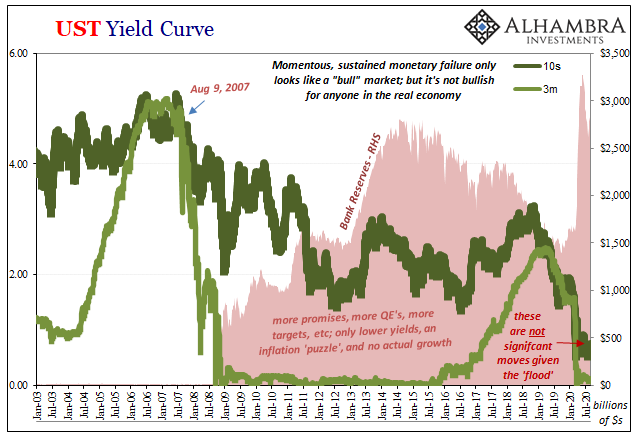
If market agents and economic participants don’t really expect much from the economy (because they’re paying closer attention to it than the little Fed Chairman’s talking head who shows up all over the internet), no matter how much central bankers scream about growth and inflation, and their “overwhelming” power to foster both, then there’s no mystery here whatsoever. None.
It really is just that simple. Just like bond yields. The only reason not to accept the results at face value is if you likewise can’t accept the drastic implications behind what that means…for central banks and their assumptions about the efficacy of monetary policies (and how they actually work).
Fat chance, flat Phillips.
Stay In Touch