If it is a day ending in “y” you can be sure there is somewhere in the financial press a story or “news report” of the looming bond selloff – even if it is due to some future event or made up phenomenon. Today’s is another in the series this time using a dramatized setup for technical analysis. A three decade old trend is inching closer to breaking:
The annual MACD is just 0.0203 below the nine-year signal line, with the gap shrinking from a 0.6401 chasm back in 1993. Yes, the lines on this chart move at a glacial pace, their current rate of change means they may not meet until some time next year or perhaps later. However, when this chart turns it tends to run a while.
Treasuries traders may need to get ready for the Halley’s Comet of chart points to appear. If it comes, it may be signal the end of the market as they and their forbears have known it.
It’s almost like Bloomberg is really short UST’s for the dedication the publisher has shown for years really on the bond bear side. It’s not so much financial driven, though, as it is technocracy. Bloomberg is planted firmly in the orthodox camp, therefore it as much as anyone else in the media is straight cheering for the Fed.
For the central bank to be wrong would mean, among several serious implications, that populist movements around the world hold legitimate grievances and are seeking legitimate answers outside the mainstream that denies them any other form of redress. Thus, Bloomberg’s financial stance is aligned closely with its political views that are uniformly anti-populist and pro-technocracy (or “elite”, establishment, whatever). The bond market must sell off as for those on this side interest rates really do have nowhere to go but up lest whole paradigms crumble.
Some of that is really deeply ingrained bias, the product of the last few decades where the central bank (the epitome of any technocracy at the present time) is treated like the center of the universe. You don’t fight the Fed is a mantra applied to mainstream reporting as well as in certain trading circles. Even when bond technicals align for lower rather than higher interest rates, as they did earlier this year, it leads often to disbelief and dissonance as this article from Barron’s easily displayed back in February:
The current sideways action seems to be a pause in a new rising trend, but recent action in both the bond market and interest-rate-sensitive stocks paints a different picture. It is now possible that long-term rates could move back down — despite increases in short-term rates by the Federal Reserve.
To be sure, the weight of the evidence on the charts still makes a move toward higher rates the greater possibility. However, given the market’s inability to get moving in that direction after months of waffling, there is now a viable argument that it may not happen at all.
What’s more important to chart analysis is the consensus view that, later this year, the bond market will once again be on the lookout for deficits and inflation. That would indeed spark an upside breakout in interest rates on the charts. [emphasis added]
Whose consensus view? The only consensus is that people remain afraid of the Fed for reasons they can’t attribute rationally. There is certainly no evidence for it going back to each of the past “conundrums” that you would think would be front and center in people’s minds right now. This isn’t the first time the bond market has behaved like this. It’s as if history started in December 2015 with the first “rate hike”, and even then it’s been a skewed narrative for unrelated reasons.
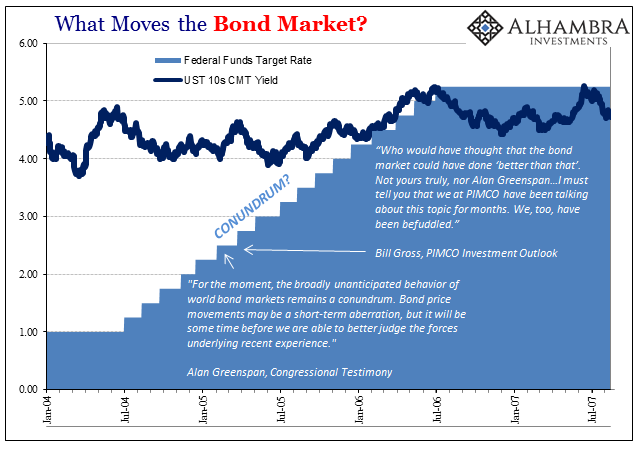
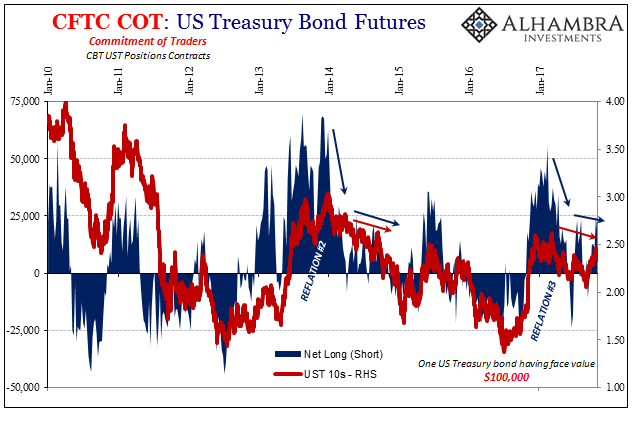
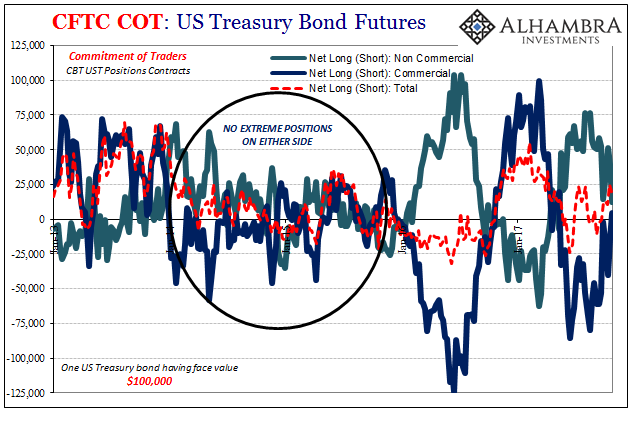
The bond market in futures was never moving in that direction, at least not this year since the “reflation” selloff of 2016. Instead, the futures market looks more and more like 2014, with a lower overall rate bias as UST futures participants settle toward less extreme positions the further we go waiting for the next big catalyst.
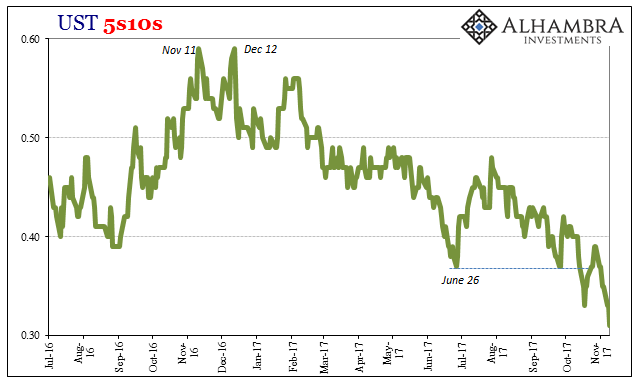
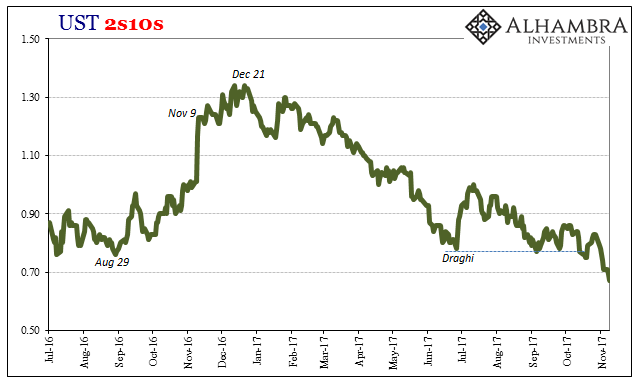
With inflation only disappointing, the labor market, too, the comparatively slight economic rebound on the wane, and liquidity risks rising (slowly) all over the world (not just US$ repo and Hong Kong) there are much clearer downside risks being fed into UST futures than what the Fed is going to do regardless of them. The result, classic yield curve flattening, is all the evidence one really needs of where things stand.

Stay In Touch