May 2022’s payroll estimates weren’t quite the level of downshift President Phillips had warned about, though that’s increasingly likely just a matter of time. In fact, despite the headline Establishment Survey monthly change being slightly better than expected, it and even more so the other employment data all still show an unmistakable slowdown in the labor market.
What’s left open for argument and concern is now a matter of how much of a downside there might end up being. Politicians and other officials have confidently reassured the public this is a natural and welcome progression or transition from red-hot inflation-y to, in the President’s word, stability.
Markets (inverted curves) are stridently betting there’s more to it than that; and by more, they’ve priced less.
It had been thought that the Establishment Survey would add about 350,000 this month, down from the 450,000 or so over the past few months and on the way toward the 150,000 Biden had predicted. The BLS today reported a rise of 390,000 seasonally-adjusted April to May, but also downward revisions to each of the prior two (March and April). It all evened out in the end, which is exactly what CES is “famous” for.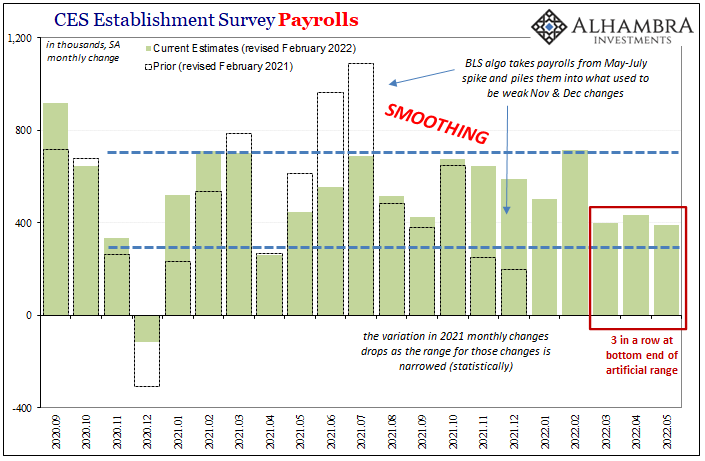
Having set up basically an arbitrary statistical range, we have to judge the data by those bounds rather than by indicated headcount. While 400,000 months are double what the labor market used to average before 2020, that’s not an apples-to-apples comparison.
Building off this year’s benchmark changes, we start with how between October 2021 and February 2022 the monthly gains were consistently near the top of the range. Since gasoline prices surged in March, they now average consistently near the bottom. With three in a row in that position, chances of this being random noise or statistical aberration fall with each successive monthly datapoint.
Rather than looking at +390,000 and breathing a politics-sized sigh of relief thinking all is well, the economy seemingly hanging in there despite all the headwinds, what the data actually shows is that something changed.
This “something changed” is replicated all over both the CES and CPS figures (ADP’s, too).
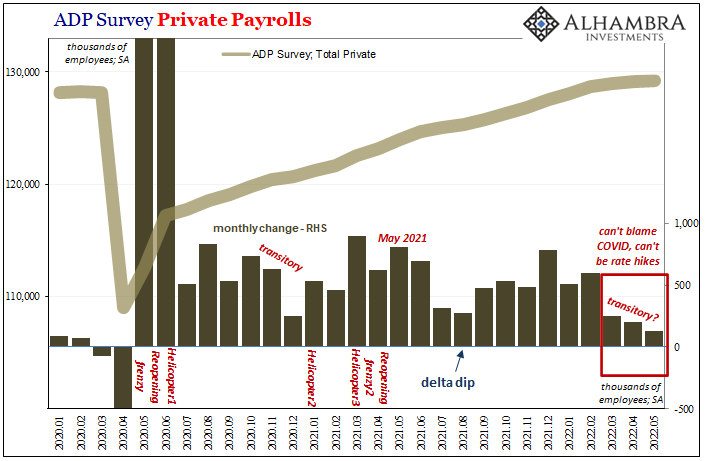
I pointed out last month how it had been the Household Survey which already suggested that very point. Given the HH is the noisy stepcousin of CES means you can’t put too much emphasis on a single month of data, though the fact that it was the first decline since the recession in 2020 already strongly proposed there was more to it than randomness.
By being substantially negative, that itself meant there was a more than significant possibility April truly had been a “bad” month for workers even if we couldn’t say for sure just how bad.
As expected, the latest HH employment estimate for May rebounded, though not enough to offset last month’s drop. In other words, that’s two months in a row where the net change remains a minus, reducing the chances this is some anomaly down even more, simultaneously propelling the possibility the data really is picking up something bad, at the very least like the Establishment Survey some as-yet undetermined downturn in the labor market.
To show you what I mean, look (below) at how many times (how few) the HH Survey has been negative on any two-month basis over the last eleven years dating back to 2011 and the start of the labor market “recovery” after the Great “Recession.” Apart from 2013’s government shutdown and 2017’s double-hurricane wreck, there are only a handful of two-month minuses and every one of those corresponds with economic downturn.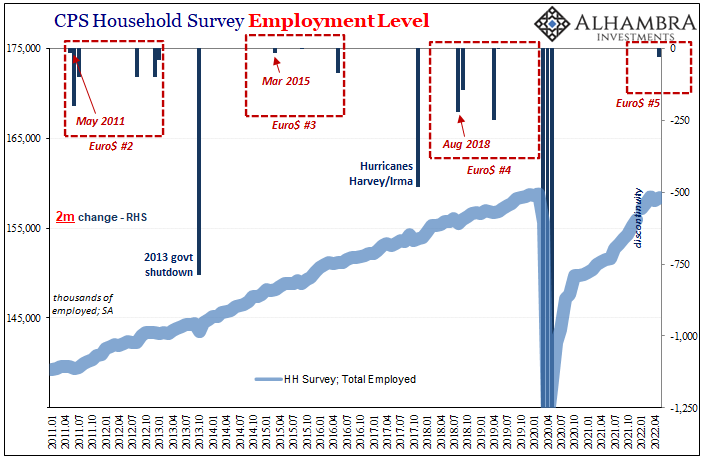
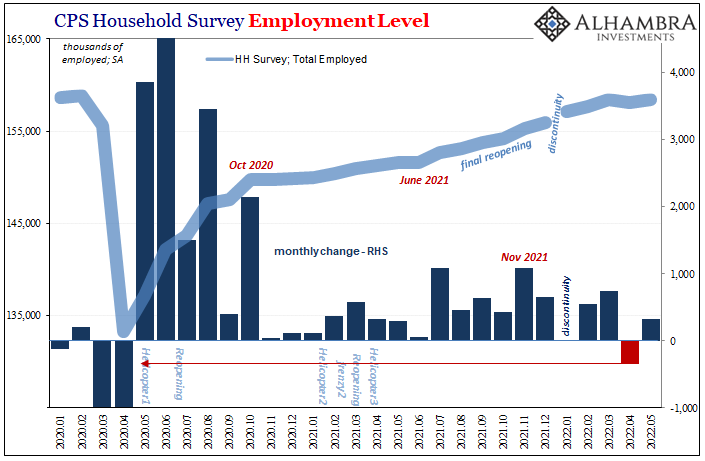
The HH Survey also agrees with CES as to the latter half of last year and some part of this year. Both indicate an acceleration in the labor market, though in this series it was thought to have occurred between July 2021 and March 2022.
Given that Euro$ #5 began back in May 2021 (by my unofficial declaration), this acceleration ran contrary to what “should” have been, and normally would’ve been, a much quicker downshift in employment (factoring employment as a lagging indicator) therefore strongly suggesting that particular upswing in labor had been non-economic; the last big push of the final reopening (after the delta-COVID interference).
That not actual recovery is almost certainly why the employment situation had seemingly defied Euro$ #5, if only until more recently.
In other words, the economy finished up last year and began this year on far more uncertain ground than it might otherwise have appeared, or had been made to appear (especially when viewed from any CPI perspective). The jobs market wasn’t taking off into the red-hot stratosphere of Phillips Curve inflation, merely still trying to dig out from the prior huge hole, more and more struggling to do so as that momentum of reopening began to fade.
The difference between those two scenarios accounts for what we see developing now (and why markets have been priced in anticipation of it). Had it truly been inflation/max employment/full recovery playing out instead of mere reopening, we wouldn’t see wage gains decelerate as they have nor could we account for the timing.
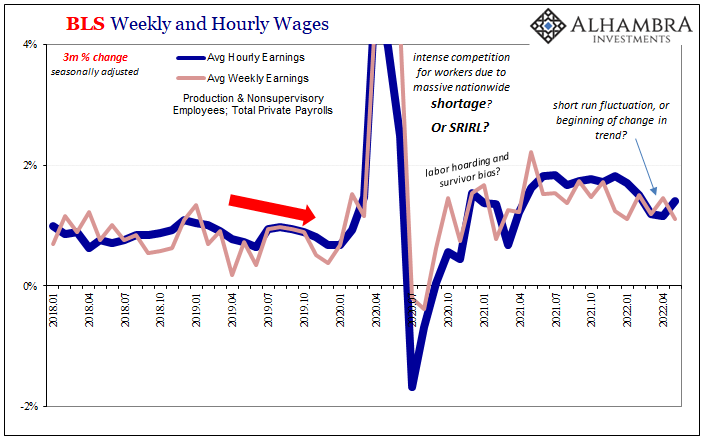
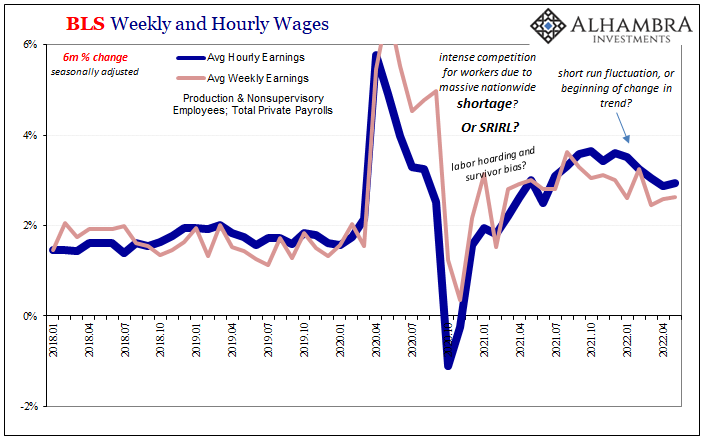
If the economy was playing currently by the Phillips Curve, we’d be at if not above full employment and wages would be accelerating wildly – you know the thing: labor shortage and scarce workers driving competition among companies who then have to pass higher employment costs back to consumers.
It’s not a crash in wages by any means, but that’s not something you ever see anyway. Second derivatives are what matter here, and whether by 3-month change or 6-month, wage gains in hourly and weekly terms are absolutely slowing down and have been since late last year (that is Euro$ #5 not labor shortage).
Even the level of acceleration in wages had always been a product of the supply shock, too, like overall consumer prices a much faster recovery in demand for workers than the labor market’s ability to supply them. It wasn’t ever a shortage, just the same artificial imbalances (rightward shift in demand given inelasticity in worker supply, often self-imposed, raising prices but not the overall level of activity; see: below). 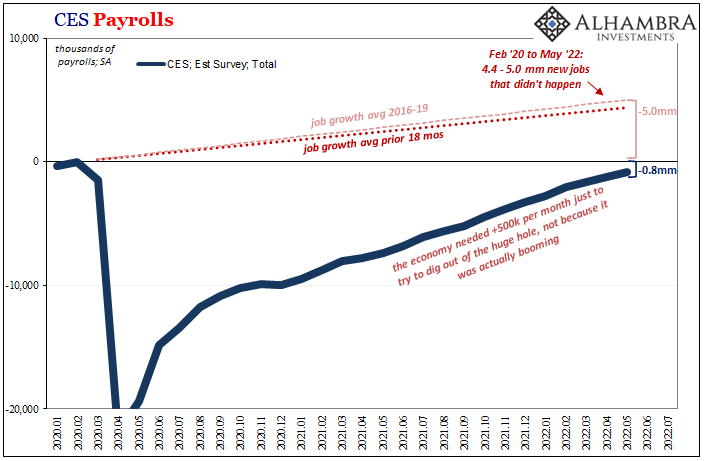
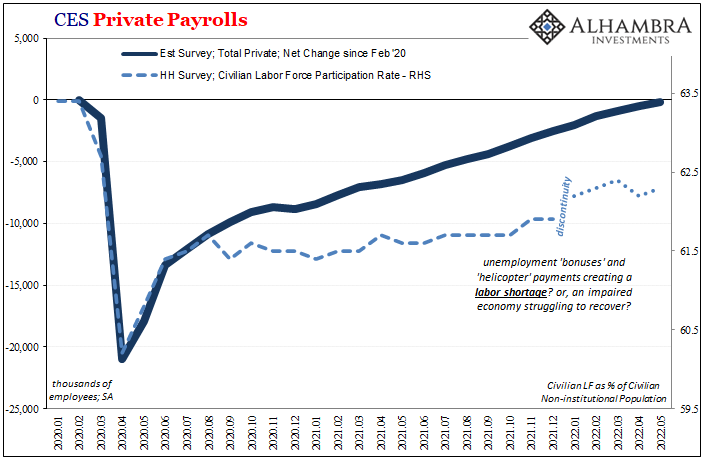
Put it all together and, yes, labor market downturn, though one stemming from the emerging downside to that supply shock and not an inflationary overshoot beyond recovery now being rescued by a proactive government goosed up on rate hikes (and the absurdity of QT’s theatrical manipulation of always-useless bank reserves). As I wrote a few days ago:
There’s a vast difference between things-are-great-so-pump-the-brakes-a-little-bit and the-plane-never-really-got-far-off-the-ground-and-now-its-engines-have-shut-down. Political theater surrounding rate hikes and now this administration-wide lean on the Phillips Curve is all about making believe of the former.
Therefore, the slowdown that is already all over every bit of labor market data looks very different from the “stability” pitched by President Phillips. Despite this month’s headline relief, even that is more than it seems. And by more, like markets I mean less.

Stay In Touch