What a time to forget it was the month for yearly benchmark revisions. After making a huge deal out of these spread across all kinds of economic accounts put together by various government agencies, I hadn’t remembered how February each year the BLS makes its contributions to correcting economic records for the payroll and employment data.
So, I wrote this earlier in the week after conflicted data from BLS’s JOLTS:
…which probably means the noisy monthly payroll will be a blowout!
And it was. Or, maybe it wasn’t. Could it have been a blowout? Possibly, but all we can say with any reasonable precision is that the whole thing’s a total mess of revisions – that were designed to try to clean up the variability of high frequency data.
I should’ve remembered not to include that word, the “noisy monthly payroll” is actually put together so as to be not noisy. The BLS wants CES figures, the Establishment Survey in particular, to come out smooth so as to be easy to understand and interpret. It is taken as the gold standard if only you accept this subjectivity.
Last year’s data was all over the place, even in CES payrolls. Why shouldn’t it have been? Unprecedented everywhere in the economy, the labor market surely no exception. According to last year’s benchmarks, the employment situation swung wildly; starting out utterly weak and low, surging massively during the helicopters and reopening, then slowed way down by 2021’s finale.
Noisy as heck.
A big no-no in the CES statistical handbook. The February 2022 benchmark revisions, up to and including the current monthly estimate for January 2022, have smoothed last year’s huge variations way down to a much, much narrower range. The big gains at mid-year are almost gone, those “extra” hundreds of thousands of payrolls pulled later to fill in the opposite side of the spectrum, the weak numbers of November and December.
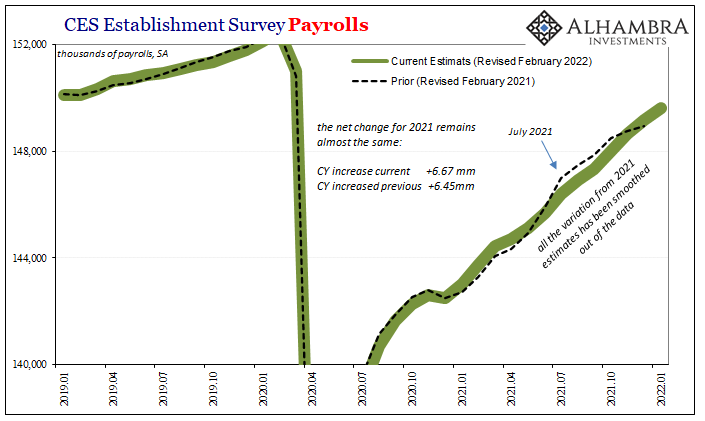
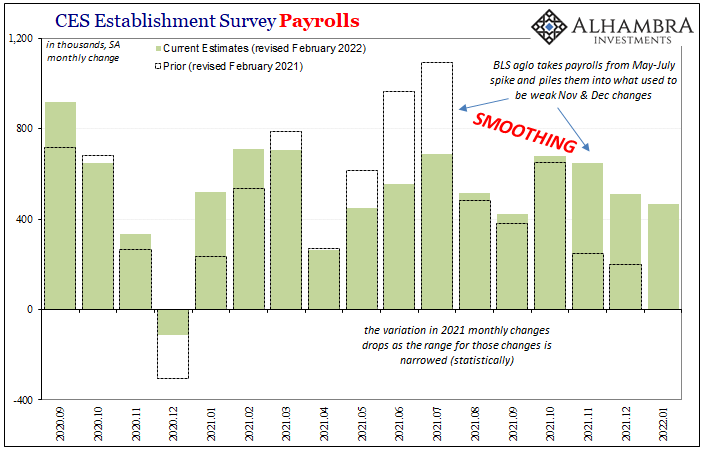
In the context of last year’s benchmark and how the series ended 2021, the current month’s change of 467,000 during January – especially as a sharp contrast with what ADP had earlier reported – would’ve been a nice blowout surprise. Instead, it’s still a slowdown from a less variable trend (above).
Under the statistical “wisdom” of the February 2022 benchmarks, the 467,000 for last month takes on an entirely different context. Better or worse depends, I suppose, on your perspective and take on such statistical manipulation (I’m not suggesting it is based on politics; on the contrary, the problem is, as always, trend-cycle theory).
But as muddy as the CES just became, you ain’t seen nothing yet. Wait until you see what happened to the Household Survey’s figures.
As most people know and maybe remember, the Census Bureau conducted its required Decennial population count which gave the agency its name. Since this is the most thorough statistical inflation anywhere, the data taken from it have been used to check other calculations (and assumptions).
For the BLS, the updating process begins with the Civilian Non-institutional population. Using its models, this other government body thought this labor-related portion of the overall public had gained only 906,000 during 2021. The Census’ numbers say that was way too low – and we don’t know what year or years, actually, the population was underestimated, just that in every likelihood it has been.
Instead, taking the Census count, the BLS now estimates the Civilian Non-institutional population had been 973,000 more by the end of last year than previously figured. But rather than go back and rejigger each monthly estimate to maintain the series compatibility, the BLS applies a “population control factor” all at once, piling it on top of January 2022.
This creates a population discontinuity for specifically the Civilian Non-institutional population, which means January 2022 and its 973,000 “extra” isn’t immediately and directly comparable to all the prior months of what is supposed to be the same series. This represents a break in it.
It only gets worse from here.
There weren’t just 973,000 more people in this potential labor pool than previously considered, nearly all of them happened to be in one specific age group:
Although the total unemployment rate was unaffected, the employment-population ratio and labor force participation rate were each increased by 0.3 percentage point. This was mostly due to an increase in the size of the population in age groups that participate in the labor force at high rates (those ages 35 to 64) and a large decrease in the size of the population age 65 and older, which participates at a low rate.
For explicitly the labor force estimate, January 2022’s population control factor was a whopping +1.53 million. You might have thought the BLS actually tried to count workers. 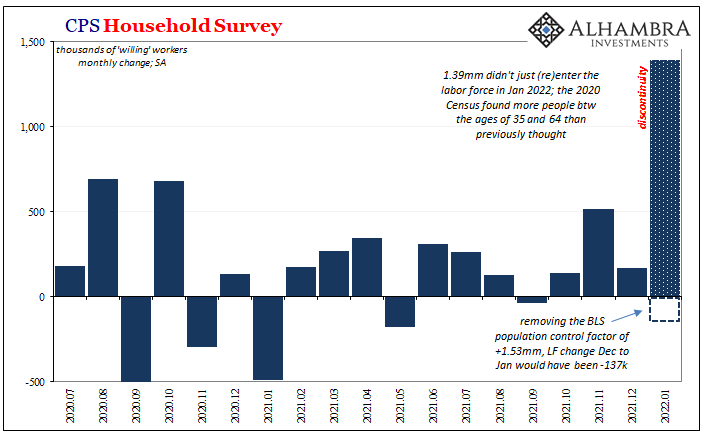
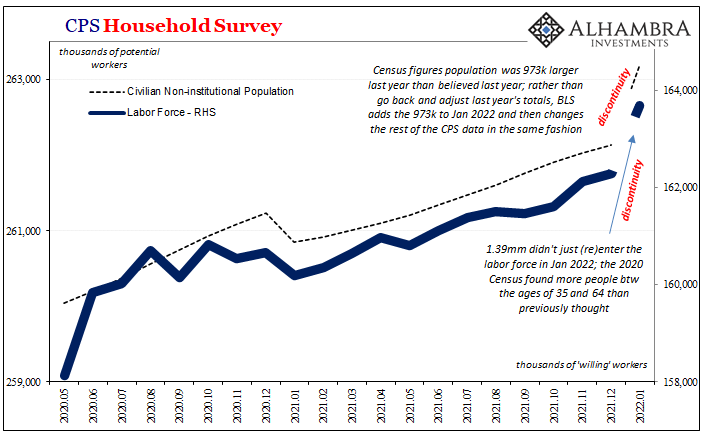
On the good side, this suggests that the participation problem hasn’t been as bad (it’s still bad) as calculated before now. On the bad side, we don’t know when or how it might’ve improved: Was the 2020 contraction less severe in forcing workers out of the labor force? Was 2021 so much better in bringing them back in? If so, at what point? To what variability, slower or faster closer to today? It could have been before 2020, for all we know.
There’s no way to tell because, again, the Census data produced a mammoth discontinuity which means we can’t (or shouldn’t) compare January 2022 and forward with December 2021 going backward. It’s like we have to start all over again brand new.
For what it’s worth, the BLS notes that without the population control factor the labor force probably shrunk again (by 137k) during January. That wouldn’t have been to much surprise.
The Household Survey employment number wasn’t excused, either, as its own population control factor affixed to the January estimate was an equally massive 1.47 million. Without it, the HH Survey’s count of employed would probably have declined by almost the same amount as ADP’s did.
Normally when discontinuities pop up every now and again, pretty much every year, they’re small and have been largely limited to the Civilian Non-institutional Population. You need to be aware of them, but they don’t make for a clean break in whatever series. The data shifts here across the entire CPS are true discontinuities.
Since the BLS data is ironically (today) titled the Employment Situation, what are we to make of January’s employment situation? Do we even know what it was?
There was last year’s mid-year uptick of some note, and then an end-of-year slowing to some degree. For the CPS stuff, other than the population controls the available and comparable data was basically the same, too. The general pattern remains if to an entirely lesser-known extent.
The noise of 2021 may be gone from the Establishment Survey, and its counterpart updated for better quality information, both counterproductively making it comparatively more difficult to figure the context of the latest figures.
For Jay Powell, this was all going to be easy no matter any of it.
Rate hikes are coming regardless of the data. Had it been like ADP, he’d have claimed omicron. Had there been no benchmark revisions, the +467k would have been his confirmation blowout.
I believe today is a perfect example of what’s going on with the yield curve. Powell’s going to hike regardless of the data, so, yet again, nominal rates rise entirely at the front. The curve from front to back is actually a bit flatter again after all these loud figures. If there was truly bright, unambiguously good news in there anywhere there’d be steepening – like there was up to the middle of last year before the latest benchmarks cut out the big surge once consistent with it.
One final note, just because. Pet peeve. Revisions to 2018 and 2019. There’s more to say about these and what benchmarking really means, but that’s enough on the subject’s subjectivity today.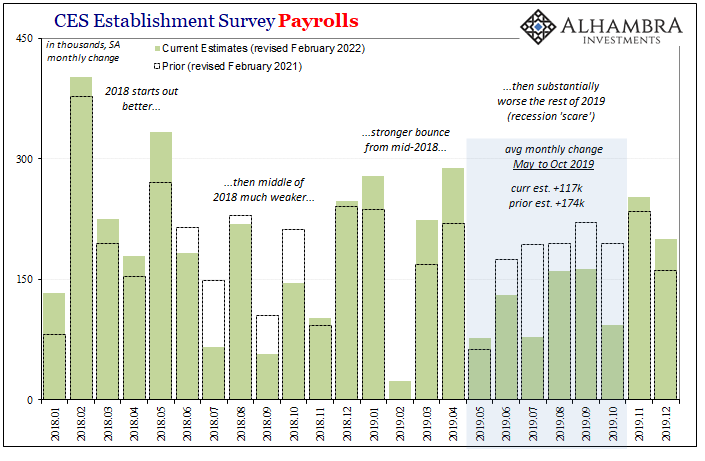

Stay In Touch