
On March 28, 1997, the Bureau of Economic Research downgraded economic growth estimates for the fourth quarter of 1996. Over the course of the two months between the advance estimate, preliminary estimate and final estimate, the BEA reduced GDP by a rather large 0.9%. The reduction in GDP then was similar in absolute size to the current revisions to Q1 2013 (-0.7%).
The five quarters preceding Q4 ’96 had seen average growth of 3.92%, so the reduction in Q4 estimates caused some concern over the state of the “soft landing” as interest rates at the time had been adjusted by Greenspan’s Fed. However, those fears were unfounded since interest rate tinkering had little impact on the coming mania phase of the dot-com bubble (and the supplements to the domestic economy through asset inflation and debt accumulation). Growth in the eight quarters that followed Q4 ’96 averaged 4.66%.
The reduction in GDP for Q1 ’13 occurs under far different circumstances, obviously, including structural changes in the aftermath of decades of monetarism. Average growth in the five quarters ending Q1 ’13 (using the final estimate) is a paltry 1.72%. In these intervening years between full-functioned debt channels and asset busts the system unsurprisingly has lost its ability to recover from cyclical swings.
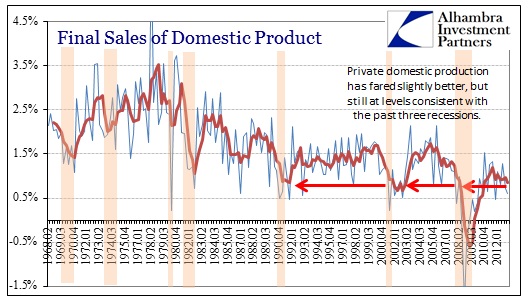
Nowhere is that more evident than the context of the private domestic economy. Incorporating the latest revisions, Final Sales to Domestic Purchasers, a measure of domestic demand for goods and services regardless of where they are produced (thus a proxy for private domestic demand as a whole), is at levels seen last in the recessions of 2008, 2001 and 1990.

Like durable goods, the economic context is beyond underwhelming here. The domestic level of demand is not responding to monetary stimulus in any way, despite assurances that it would. If anything, according to this chronology, it very much appears as if the more financial and monetary interference is perpetrated the less the economy is able to grow. Recoveries have all but vanished in the 21st century despite (or likely because of) the heavy hand of intentional inflation (in these cases, asset inflation).
If the BEA were to use this basis for determining economic sufficiency, the latest revisions would have downgraded growth even more than they had already. As it stands from the final estimate, overall GDP grew by an alarming 1.8% in Q1, down from significantly from the 2.5% estimated in April – and coming immediately after 0.4% in Q4 ’12.
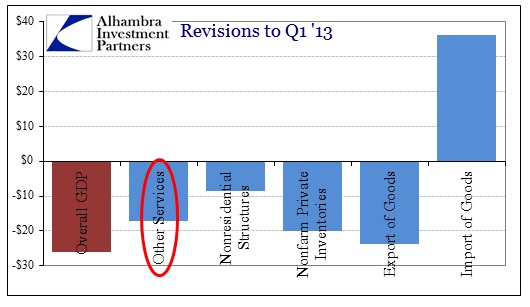
Most of the revisions came from four categories (with a fifth “offsetting” due to the way GDP is calculated), “other” services, nonresidential structures, nonfarm private inventories and exports of goods. The lower revision to both exports and “other” services, which includes telecom spending, as well as education and professional services, were not unexpected given subsequent data reports. The downward change in inventories is also consistent with other indications of end demand in those markets (particularly telecom), but to a greater degree than might have been expected. In fact, according to these latest figures, nonfarm inventory growth reversed off even Q4’s low level. In the GDP growth calculations, nonfarm private inventory went from contributing 0.25% to subtracting 0.26%, a 0.51% swing in the GDP growth rate through inventory alone.
Offsetting these downward revisions was a reduced estimation of the dollar amount of imported goods. Because imports are a subtraction on GDP, lower imports is GDP “positive”. But, as we see from final sales, while it might be technically a boost to GDP, it certainly indicates a lower level of domestic demand.
Relative to the weak level of domestic demand, domestic production has fared marginally better, but the decline in export estimates has brought final sales of domestic product lower as well.
Bottom line – there was little positive in these revisions. Even where the new estimate actually indicated an increase in spending or activity it wasn’t necessarily indicative of health. The primary example here was personal spending on nondurable goods, revised upward solely on an increase in gasoline expenditures (due to prices). In the end, what we see here is the intersection of an economic cycle (on the downswing) contained within the larger and longer structural changes in the economy of the bubble age.
Click here to sign up for our free weekly e-newsletter.
“Wealth preservation and accumulation through thoughtful investing.”
For information on Alhambra Investment Partners’ money management services and global portfolio approach to capital preservation, contact us at: jhudak@4kb.d43.myftpupload.com
Stay In Touch