
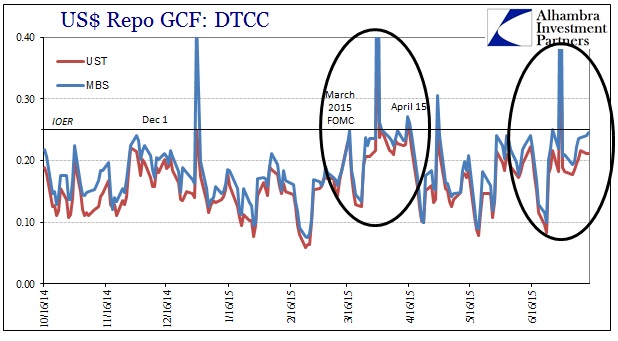
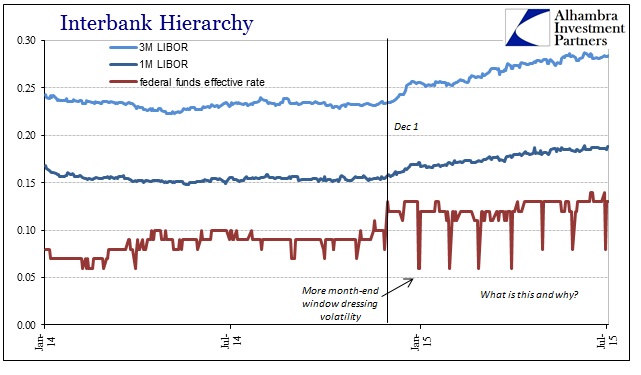
With Greece settled and China moving away, for now at least, from the edge, it appears as if the “dollar” has settled back from the collateral calls of last week. That would make July 15 as seemingly as much of a dud as April 15 was, both in sharp contrast to October 15 and then January 15. That does not mean, however, that the quarter-end period is uninteresting; far from it.
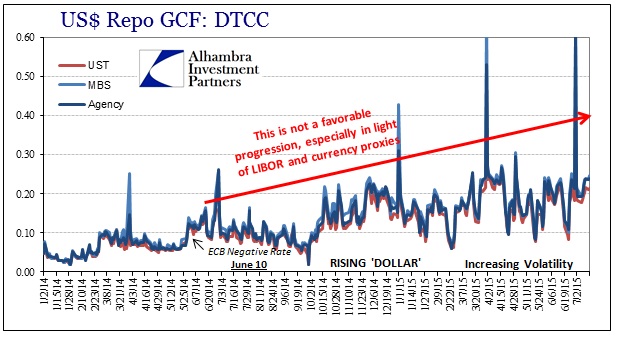
While there is some repetition in other indications like swap spreads, especially the 5-year, it is GC repo rates that exhibit the most visible calendar relationship. GC rates ticked up again today, as yesterday, nearly touching IOER in both MBS and agency. This was exactly the same as the two weeks immediately following the end of Q1, where repo rates remained significantly elevated until around April 15.
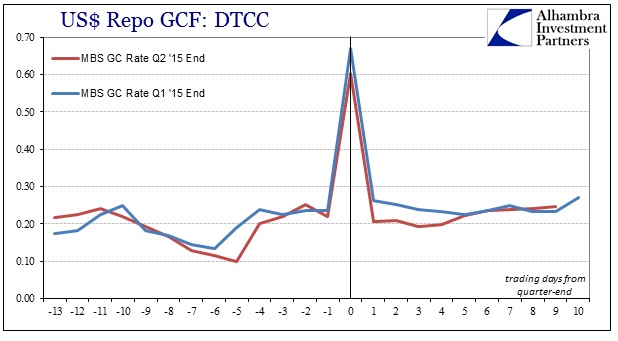
This pattern seems to have occurred in just the last three quarters, which would seem to be consistent with money market and “dollar” behavior amplifying negatively after October 15 (leading to more widespread and visible alteration after December 1).

The activity at year-end 2014, moving toward January 15, first shows this pattern but it has been the last two quarters that are so remarkably similar as to be either a complete error or significantly fractal.
Rational expectations and orthodox, random walk treatment of “market” prices says this should never, ever occur. All modern finance dating back to Louis Bachelier in March 1900 is premised on the assumption that “market” prices exhibit no memory.
In it [Théorie de la Spéculation], Bachelier established Wall Street’s “random walk”, noting confidently, it was all mathematics, after all, that, “there is no useful information contained in historical price movements of securities.” In other words, the price of stock or bond yesterday has no bearing on the price today. That opened the door to statistics in finance under normal, random distributions.
By all rights of modern finance, the repeated trajectory of repo rates shown above is impossible. Yet, they exist and aren’t that difficult to comprehend or even describe. The modern, wholesale system that interchangeably uses balance sheet liabilities of all types as forms of currency is tied, almost in ancient modes, to quarter-end reporting including shareholder reports. That leads to window dressing that is far more than conspiracy theory (Lehman’s repo 105), as clearly the wholesale system is replete with systemic bottlenecks in especially liquidity due to the rise and fall of balance sheet capacity in and around making balance sheets look less stretched.
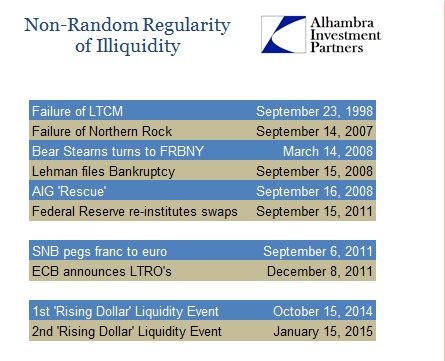
The repetition of major “market” events surrounding quarter ends is not random chance, which is why “tail risks” aren’t that. The amount of kurtosis it would take to explain these clusters obliterates the normal distributions, which, again, amounts to still further proof that Bachelier and all his disciples are using a fatal construction and conceit.
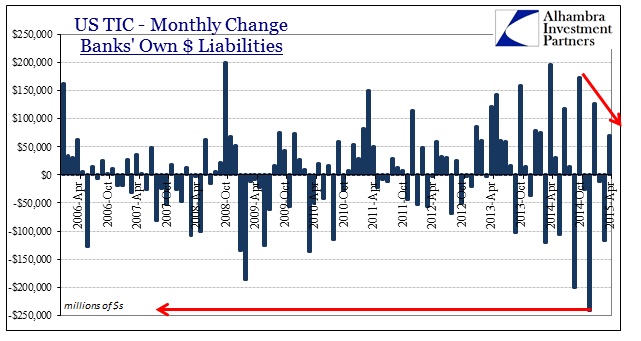
What is noticeably missing these past two quarters as different from the two that preceded them is active selling pressure. In other words, systemic liquidity is not, again, enough to produce a significant “event”, as it is but one component. To create a “tail event” requires both systemic liquidity trouble or bottlenecks and active selling (which, in the case of October 15 turned into collateral bids on UST, but it was selling and price pressures elsewhere that, despite the Treasury Dept’s conspicuous incuriosity about that day’s events, set off the chain reaction into open disorder in UST forcing them to at least address it).
The “dollar” progression in all this is actually startlingly clear. Repo rates are following an easily observed ramping toward illiquidity that traces back to the start of the whole “dollar” problems last year – in and around the ECB’s decision to negative nominal deposit rates. Since that point, the repo market’s agitation has grown in steady fashion, which seems to explain why the systemic bottleneck surrounding quarter ends has become too deep in just the past nine months. That deficiency is, as noted in LIBOR and TED, pulled to even greater extremes after December 1 – but without any resolution or even abatement.
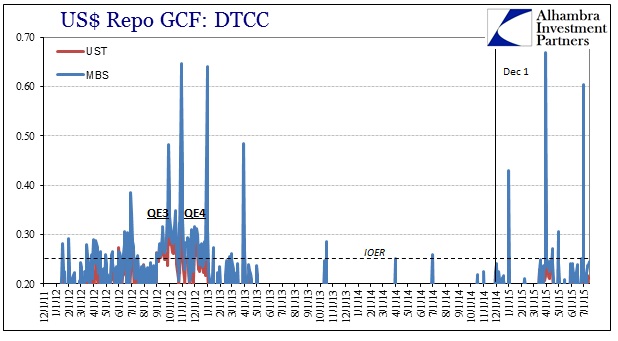
This is all undoubtedly related to the ongoing decay in the eurodollar standard, as banks around the globe scale back not just money dealing activities but also the more esoteric and hidden forms of leverage via mathematical constructs as derivatives. That deterioration predates, obviously, the past year which suggests that the changing paradigm surrounding economic views or post-QE & ZIRP volatility make money dealing even less profitable than it was being taken before. In other words, banks were already planning on exiting especially after taper problems in 2013, this latest upset seems to be moving them in that direction at an accelerated rate.
Liquidity is somewhat of an enigma, so highly misunderstood. What you see right now is not what you can expect in the most needed application, as liquidity in its most accurate sense is what you might be able to count on when the chips are down and the circumstances grow truly dark. The action in GC repo suggests not to expect too much with the “dollar” world looking much more precarious with each passing quarter. That is the legacy of math as money and currency, as it is by nature self-reinforcing and heavily pro-cyclical. That much we already know just by what keeps recurring and when.
Stay In Touch