
When it gets cold outside and the pandemic throws another variant spread into the mix, Americans have proved they will come together…in virtual fashion to go shopping for fashions and more on Amazon. For the second straight post-Christmas winter, retail sales recorded by nonstore retailers ended up being far, far better than expected.
According to the Census Bureau’s latest report for the month of January 2022, seasonally-adjusted sales by mostly online operators skyrocketed by 14.5% from December 2021. This wasn’t an annual gain, the nearly 15% increase was month-on-month, the second largest such in thirty years of data behind only last January.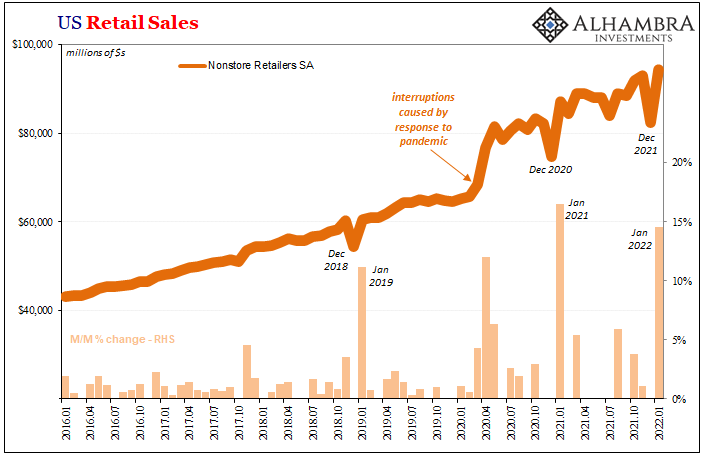
Given that much of the “inflation” over the past year or so can be traced to this very phenomenon – instead of doing things or spending income on services, consumers inside their homes buying online largely from overseas producers thereby clogging shipping channels – this is the most likely what set the hashtag #emptyshelves trending during January.
If so, it would help explain last month’s CPI numbers, too.
What’s perhaps more interesting and more difficult to explain (given just this data) is the concurrent December to January pattern which repeats here not just for the second year in a row, also for the third time since the first instance had cropped up all the way back in December 2018 and January 2019. Why two years repeating Euro$ #4’s landmine behavior?
The need to save on sales tax for January purchases?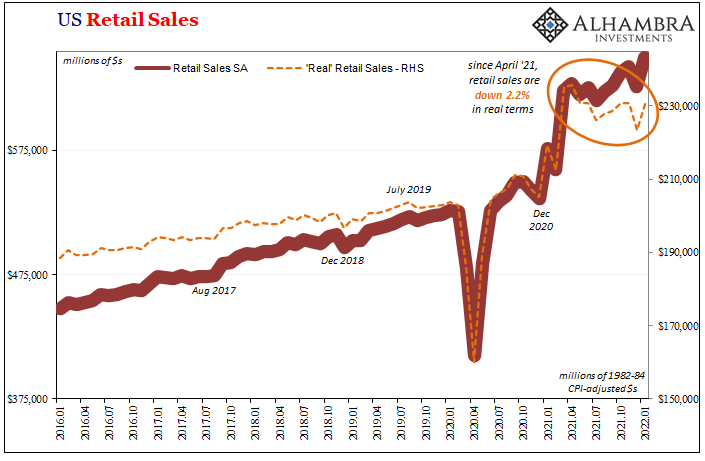
 In nominal terms, Census reported a huge increase in retail across most segments. Total retail sales were up an enormous 3.75% (seasonally adjusted) December to January thanks in very large part to all that went to Amazon (and its competitors).
While US consumers continue to spend, the level of spending is actually converging with the pre-COVID trend if ever so slowly. Total retail sales remain elevated compared to that trend, but that elevation since last April has been entirely due to price changes. It’s a story of money illusion being repeated throughout the world.
“Real” sales deflated by the CPI increased 3.0% month-over-month in January, after having fallen by 3.1% November to December suggesting the actual volume of goods being purchased regardless of where or how is converging with that prior trend the more the months roll by.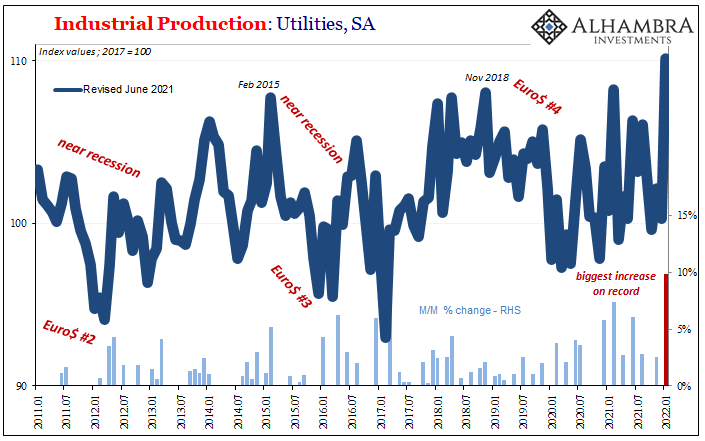
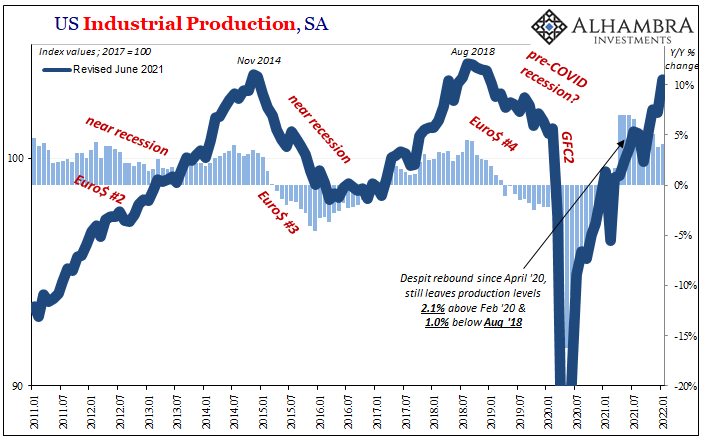
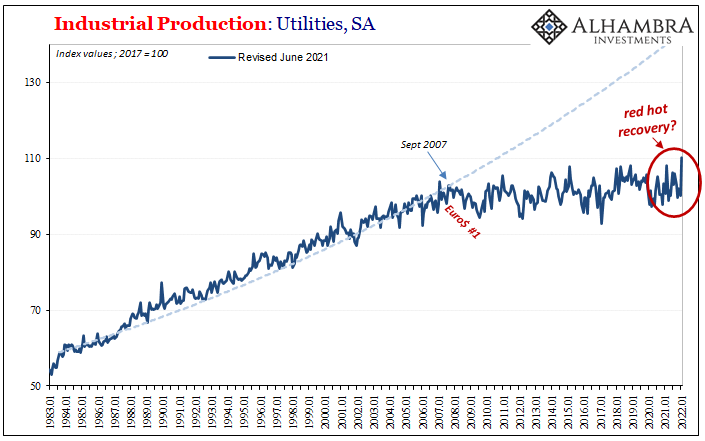
This may be why, yet again, production volumes and levels in the US are nowhere near as raised as the nominal sales of goods have been. As to the former, the Federal Reserve today said that total Industrial Production gained 1.4% January compared to December, itself a pretty substantial increase. However, nearly all of it was due to a severe cold weather impact (contributing more to Amazon’s good fortune) spiking its utility index by a single-month (seasonally adjusted) record of 9.9% last month.
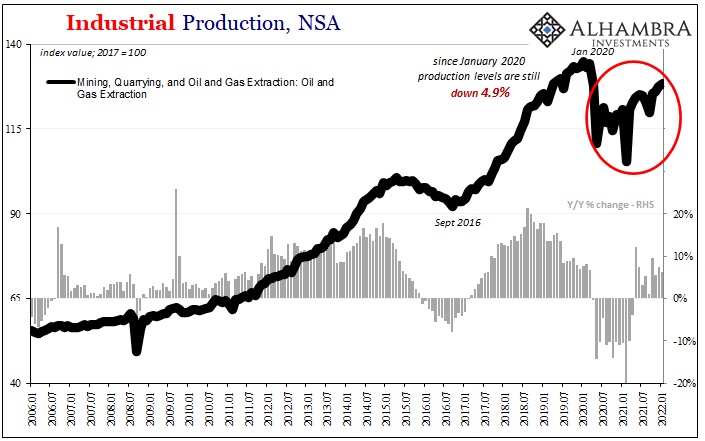
Excluding utilities as well as mining (where crude oil and natural gas production are still only modestly rising and each remain substantially below January 2020 output), manufacturing output added just 0.2% (seasonally adjusted). Even though the COVID recession was almost two years ago, domestic manufacturing in January was only a tiny, fractional bit higher than it had been in November 2014 while still less than August 2018).
Apart from the need for utilities, these are nothing like overheated. 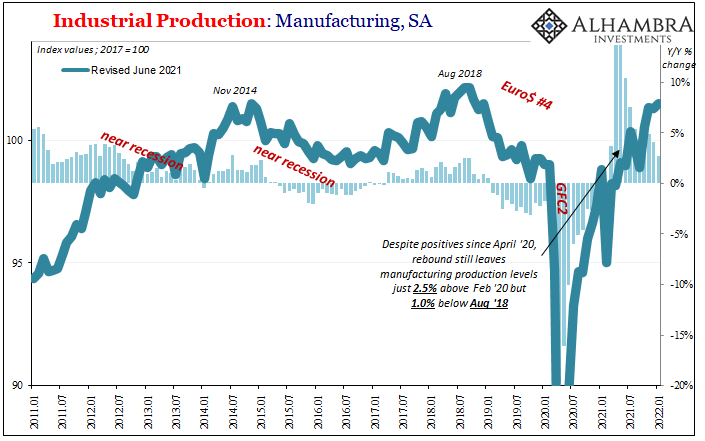
Why aren’t goods being produced at a rate or pace anywhere close to retail sales?
Prices vs. volume is a key reason, as is so much marginal demand spilling over to overseas producers (and still the global economic rebound has been unusually weak!) The more online shopping because of cold weather and COVID fears, the occasional government-mandated restriction, the more goods – at the global margins – have to be shipped into the US to meet it, making everything on the way there to here that much worse.
This then pushes up prices even more, adding to the illusion of a “red hot” recovery badly in need of Federal Reserve rate hikes to cool it all down and get control.
Volumes, especially production, give away the deception. IP for utilities is actually a perfect example of this; after January’s cold snap meant surging demand for heating, the Fed’s utility index reached a record high. It was its first time ever (when 2017 = 100) above 110.
Given that utility usage tracks general economic growth (for obvious reasons) rather closely, just in describing these results at first it appears consistent with the background behind the Fed’s elevated rate hike urgency; Americans using a ton more electricity than ever before, even if January was a lot to do with extra wintry winter.
Except, again, it’s all an illusion.
Sadly, it’s the same one that has been pulled on the economy since August 2007. The recovery from this last recession isn’t one, just like the one before it hadn’t been, either, and what there had been of a 2021 rebound had been fueled by artificial means and is slowly fading down the stretch into 2022.
The only difference this time is the effect the supply shock (relative inelasticity of supply given rebound in demand) has had on consumer prices. That doesn’t make it any less transitory, and it doesn’t mean the “growth scare” of late last year has been surmounted.
To the contrary. The Fed is hiking rates into that slowdown into which the real state of the economy is more and more proving itself once again.
You can easily understand why, I think, the market is rejecting those very hikes; or, specifically, the reasons for them. A combination of bad theory (expectations plus the unemployment rate) plus guaranteed political pressures to appear to be doing something about this “red hot” economy and its “inflation”, it’s a perfect recipe for yet another policy-error error.
Stay In Touch