
The ISM for August was the lowest reading since the taper drama of 2013. At just 51.1, there isn’t any real basis for suggesting the manufacturing sector is even expanding (no matter what these sentiment surveys claim about that 50 dividing line). The “correct” interpretation is one which discards the exact figure for the relativism. For once, media commentary was in the ballpark:
Manufacturing in the U.S. expanded in August at the slowest pace since May 2013 as anemic demand from emerging markets such as China translated into leaner factory order books.
The Institute for Supply Management’s index fell to 51.1, lower than the Bloomberg survey median, from 52.7 in July, a report from the Tempe, Arizona-based group showed Tuesday. A measure of exports matched the weakest reading since April 2009.
“It raises a warning flag about the outlook,” said Joshua Shapiro, chief U.S. economist at Maria Fiorini Ramirez Inc. in New York. “We’re going to have an inventory adjustment and, on top of that, weak exports are going to remain a weight. We’ll see a period of time when manufacturing is soft.”
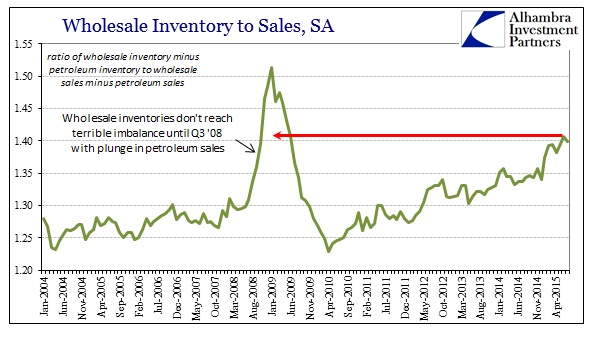
With the direction for manufacturing established, what’s left is arguing about the degree of adjustment that is, in time, absolutely going to take place. The driving imbalance remains inventory which, in the context of sluggish and even contracting sales, suggests to me something far more than “soft.” And that view was formed even before the second “dollar” wave fully crested. I don’t think the sales imbalance from that is yet revealed, though the updates in manufacturing from the regional Fed surveys suggest it’s getting quite serious.
Manufacturing activity in New York state declined for a second straight month in September due to steep drops in new orders and shipments, and employment in the sector also fell for the first time in more than two-and-a-half years, a New York Federal Reserve survey showed on Tuesday.
The New York Fed’s Empire State general business conditions index came in at -14.7 for September, barely changed from -14.92 in August, which had been its lowest since April 2009.
And:
Factory activity in the U.S. mid-Atlantic region contracted unexpectedly in September for the first time since February 2014, a survey showed on Thursday.
The Philadelphia Federal Reserve said its business activity index fell to minus 6.0 in September from positive 8.3 in August. The September reading was well below economists’ expectations of 6.0 according to a Reuters poll and marked the weakest reading since February 2013.
Manufacturers in the central Atlantic region reported a deeper-than-expected contraction in activity this month, the Federal Reserve Bank of Richmond said Tuesday.
The Richmond Fed’s manufacturing current business conditions index slid to -5 in September after flatlining in August. In July, the index stood at 13.
Economists surveyed by The Wall Street Journal expected the index to slip to -2. Readings above zero indicate expanding activity.
Most of the survey’s subindexes were decidedly negative in September, paced by a sharp decline in new orders to – 12.
And the oil patch, which suggests oil isn’t the sole problem any longer:
Texas factory activity was essentially flat in August, according to business executives responding to the Texas Manufacturing Outlook Survey. The production index, a key measure of state manufacturing conditions, climbed to near zero (-0.8), suggesting output held steady after five months of declines.
Perceptions of broader business deteriorated markedly in August. The general business activity index dropped 11 points from -4.6 to -15.8, and the company outlook index also posted a double-digit decline, coming in at -10.3.
Labor market indicators reflected slight employment declines and stable workweek length. The August employment index was negative for a fourth month in a row but edged up to -1.4. Fifteen percent of firms reported net hiring, compared with 16 percent reporting net layoffs.
It should also be noted that China’s last PMI was in “contraction” below 50 suggesting that the foreign flow of goods in this direction is very likely beyond “soft.” That is, I think, the greater problem with mainstream interpretations about manufacturing and goods in general. It seems the popular consensus is that because there aren’t manufacturing jobs left in the US that as long as some service indications (of dubious value) aren’t as bad as manufacturing that counts far more for the expected economic direction. In many ways, that is why “unexpected” continues as a permanent part of the commentary.
The goods economy is much more than manufacturing. While those base level jobs are mostly gone, a huge proportion of the so-called service economy is actually predicated on the movement and especially sale of goods. Further, even more raw services are themselves at least partly based, if more indirect, upon manufacturing and goods (I am not making any claims on whether this is the way it “should” be, only that this is the economy as it is now).
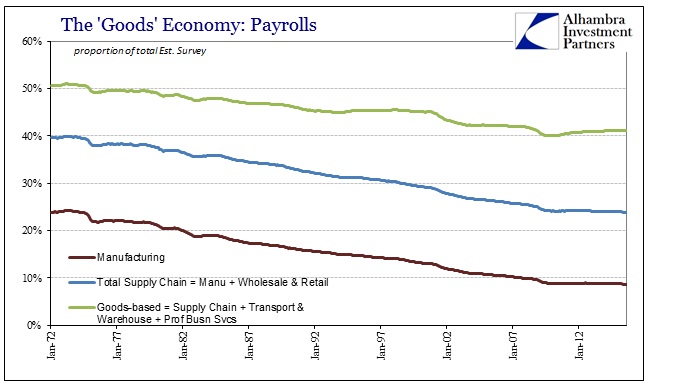
Where manufacturing jobs are less than 10% of the total (Establishment Survey estimates, setting aside any questions of its veracity lately), adding wholesale and retail level payrolls (the full supply chain) we are already at one quarter of all payrolls. There are also warehousing and transportations jobs, mostly if not fully concentrated on moving goods (and some people) up the supply chain. In addition, professional and business services jobs more often than not are attached in some way to the goods economy. That suggests somewhere around 40% of all employees with some connection to goods.
However, that total comparison includes the public sector and government jobs. The proportion of the goods economy associated strictly with the private economy is just under 50%.
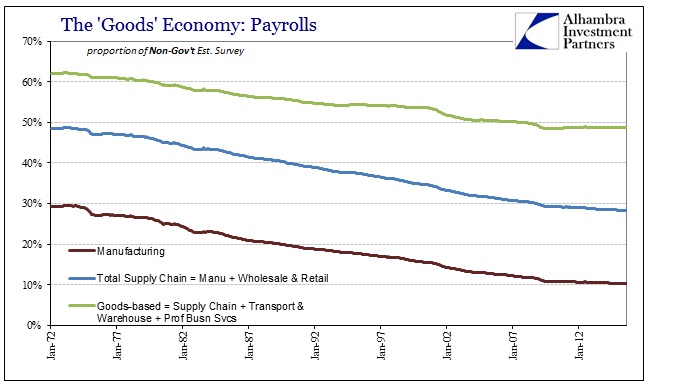
As you can plainly see in the chart immediately above, while manufacturing jobs have sunk from 30% of the non-government Establishment Survey in the early 1970’s to barely 10% now, overall the deterioration (or reallocation) has been much, much less stark (though still large). That is simply the fact that though marginal manufacturing has left, there is much economic activity derived from again moving goods from whatever source (foreign and domestic) and then expressly selling them.
What I think is most important about this view, again setting aside the quality difference in that changed proportion of the supply chain (a job in retail is nothing like a job in manufacturing; that is a separate and significant problem), is that the goods economy overall isn’t much different than it was at the last peak in November 2007.
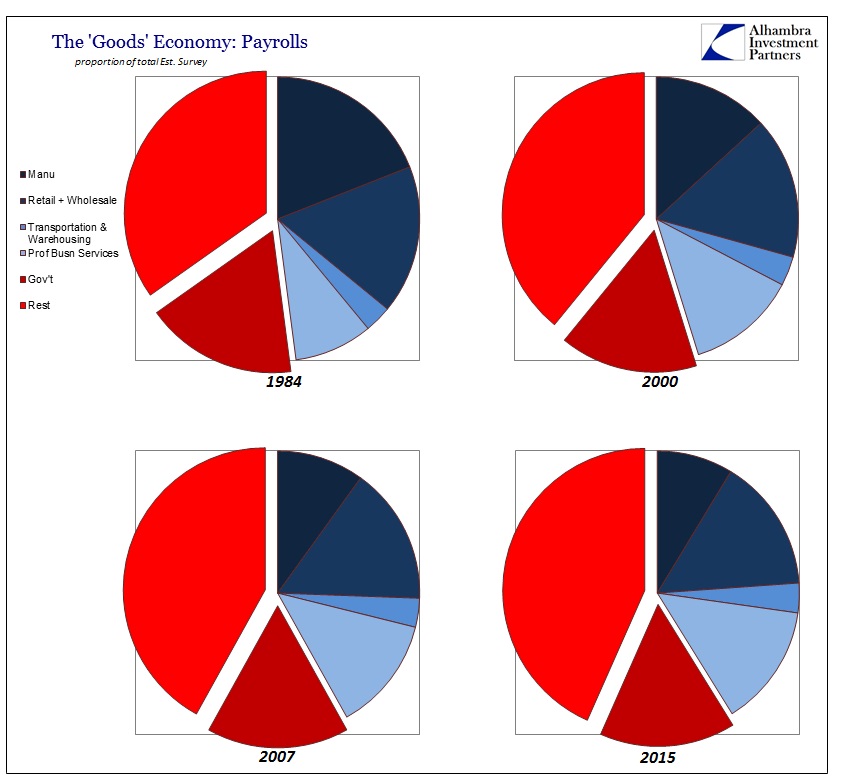
Where there is a clear diminishment in the goods economy, so-called, from earlier decades, in the 2000’s but especially since 2007 that hasn’t further shifted. Thus, in terms of overall economic exposure should manufacturing really take a turn for the worse, there is, I believe, an underappreciated link between goods and at least employment (and an overstated imagination of the purely service sector).
The implication is thus quite obvious, given the inventory imbalance and the potential goods contraction not just in the US but everywhere else. That is particularly worrisome when production is already decelerating rapidly, and even outright declining already, but inventory hasn’t budged. At some point, the adjustment will have to be made and the longer it goes the sharper it will likely be; extrapolated via just these employment proportions is a bit more than “soft” to the whole economy.
Stay In Touch