
For statistics like GDP, what is most important is relative comparison between the most recent quarters (or years). That narrow view misses a lot of important context, an aching factor when structural or longer-term defects in actual economic function drag on long past the points of tapered comparison. In that way, by only measuring the most recent relativity these statistics can be misleading (especially since the opportunity cost of lost compounding in prior years is never reconciled).
That is certainly the case with the payroll reports that look to be almost robust in comparison between 2013 and 2014, but is wholly deficient when compared to the prior cycle peak in 2007 (particularly that full-time jobs are still more than a 1 million fewer than November 2007). If you are stuck in viewing only the most recent data it may look like a recovery, even sufficiently strong. If you instead compare the longer run, this “mystery” about why so many view the current economy as more than incomplete makes more sense.
In the middle of last year, the Bureau of Economic Analysis “updated” its GDP benchmarks, significantly altering the trajectory of what we assumed was economic progress. The net effect of that was to “take away” GDP from 2011 and 2012, which altered the basis by which 2013 and 2014 was compared. Less growth in the earlier years made for “better” growth rates in the later years. However, while that “base effect” aided more recent growth rates, the overall economy under the revised benchmarks was actually smaller (lower base for compounding) in the end.
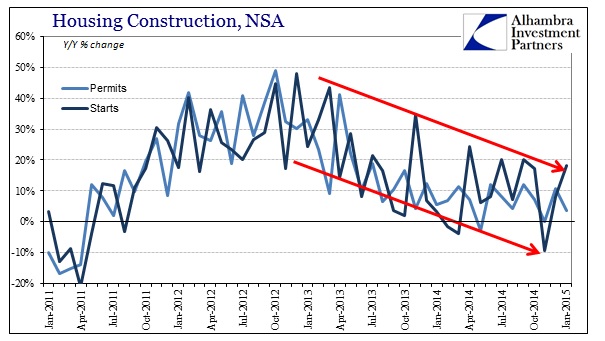
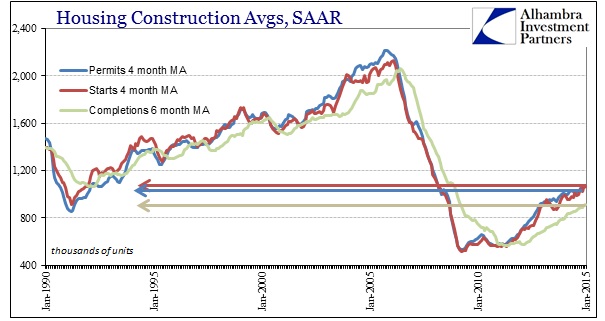
The most recent release of housing construction statistics from the Census Bureau has followed that pattern. There were significant revisions to only permits, with essentially 2013 being estimated less robustly thereby making for much better growth rates in 2014. However, both the revised and prior series end up in much the same place, so all that changes is that 2014 looks better in growth rates by comparison to the “downwardly revised” 2013 – both remain mired from the proper longer-term perspective.
The problem of all these revisions, especially when they amount to no more than base effect changes, is that they seriously reduce the quality of the original series. This works against even when the statistics are seemingly optimistic, in that activity that seems to be happening may just be a “phantom” when next year’s revisions come out (to max up the current year). Overall, housing construction seems to have flattened out despite the changing appearances, but when February 2015 rolls around we may find out that construction is actually contracting right now (which would, once more, increase next year’s growth rates).
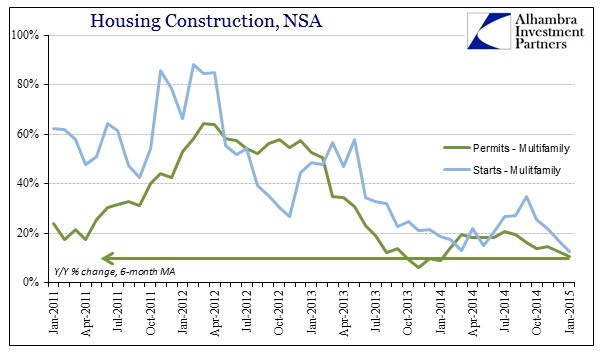
The revised figures (again, permits only) show the continued slowdown in construction, but now without any of the negative months that were calculated prior. While there was some revision (upward) in single family permits, most of the revisions affected multi-family construction.

The new growth rates in apartment construction aren’t all that much better in more absolute terms (meaning, in this context, compared historically beyond just this year to last), but there is a clear jump in the middle of 2014 that before these revisions was just a steady downward slope toward zero.
In that respect, permits activity takes on more of the shape demonstrated by the starts series, however by the end of 2014 even those upward revisions to growth rates are again pointing in the same downward direction.
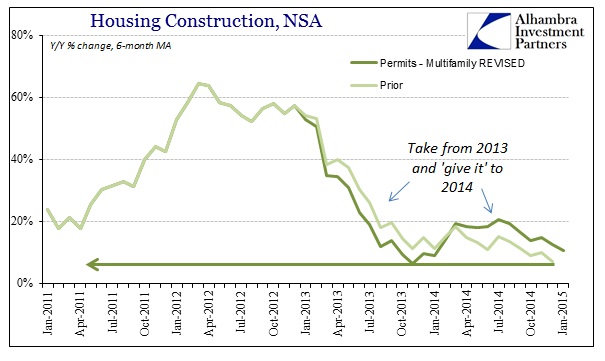
So the data ends up in largely the same place meaning that all that really changes is the perceptions of 2014 compared to 2013 rather than the far more important 2014 compared more broadly and historically.
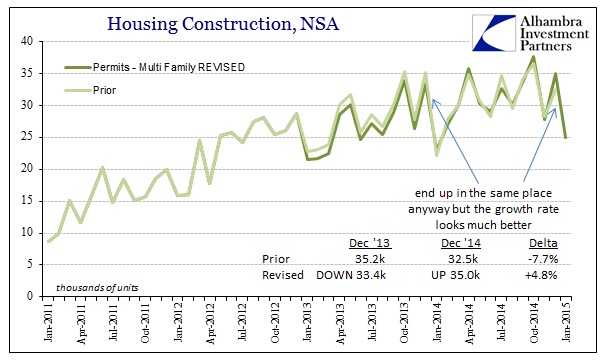
You can see by the chart immediately above that apartment construction gains have largely come to a halt starting around October 2013. But the revisions have a significant impact upon base effects – December 2013 was revised downward, where December 2014 was revised upward, turning what was last month though a -7.7% Y/Y change into this month a +4.8% growth rate. The same was repeated in prior months: for example, October 2014 has gone from +3.4% to now +11.2%; August 2014 from 10.5% to 18.0%, etc. So for anyone simply analyzing the most recent figures via growth rates, 2014 looks appreciably better now than it did last month.
And none of that really matters as the overall pace of construction in apartments, and even single family, has slowed considerable compared to the mini-bubble period that started in 2011. In that sense, the revisions have been a zero sum game, taking from 2013 to give to 2014 and once more ending up in the same reductive state. For me, this all amounts to splitting hairs once more, as it doesn’t much matter 10.5% from 18.0% since overall home construction of any type remains stuck at historically depressed levels – that fact survives all these revised views. That does not suggest an economy moving robustly, only that the refiguring of relatively narrow comparisons makes economists feel better about how home construction seems to conform to the recovery idea in the current year – at least until next year when this year gets its now-expected trimming.
Stay In Touch