
If there is a set of data points that should be most concerning and useful (in that regard) to policymakers they are certainly related to junk debt. You can throw away even the irregular nature of GDP and surely ignore the Establishment Survey and unemployment rate. Given that those statistics are at least captured by a greater governing dynamic (which is why they seem to be so off most of the time) and that superseding set is almost surely the work of artificial monetary forces, predicting trajectory might better be served by paying closer attention to the most visible outlets for the synthetic direction.
In this case, there should be more alarm about the fact that junk debt has proceeded now through a second lower channel. The first “inflection” occurred in May 2013, which was nearly re-attained by June 2014 when the “dollar” so drastically interfered (again; to be precise). And what should scare policymakers the most, junk debt prices are no longer evidently irrepressible. While prices are better than the December 16 low point, there are still well-below either of those prior peaks.
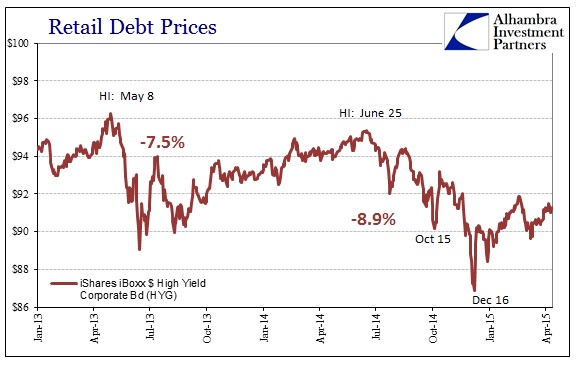
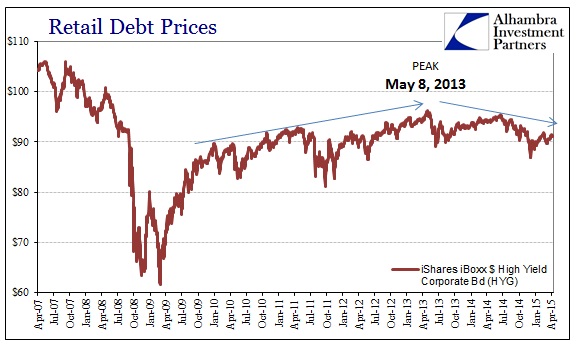
Aside: it should be noted here that I am using the unadjusted closing price for the HYG fund, rather than the adjusted price that is typically meant for longer-term comparisons about total returns and such. I don’t want to turn this into a discussion about the merits of adjustments, but I will note that the alternate view of debt prices presented below conform very, very closely to the unadjusted price, which does seem to suggest a more realistic approach apart from all the statistical and added interference of the adjustments.
You don’t have to be devoted to technical analysis to appreciate what are clearly lower highs and lower lows dating back to the first utterances of the word “taper.” We can interpret that as a potential rift in appetite and construction of forces supporting the junk binge. That certainly makes intuitive sense since the taper drama in mid-2013 was a itself a major rupture in all manner of financial settings, but especially about perceptions of QE and its place within the financial superstructure about risk(s) (taking account of the former view of “forward guidance”).
The fact that the market for junk debt hasn’t simply fallen apart is not at all unsurprising, as even crashes are processes that are drawn out by slowly evolving perceptions. What we can surmise of this retail end of junk prices is that just such an evolution may be in progress, and has taken on a heightened awareness or development during this latest “dollar” fissure.
That view is more than supported by the price structure of deeper elements of the junk market – leveraged loans. While this asset space has become more known in this artificial cycle as opposed to the last, leveraged loans may not be yet mainstream. They are the bank-driven version of junk, only syndicated and often packaged for institutional consumption. So where HYG might be “forgiven” of sorts for being priced by “dumb” money, leveraged loans have no similar deficiencies (which are more of lingering convention than reality, as, again, this data seems to suggest).
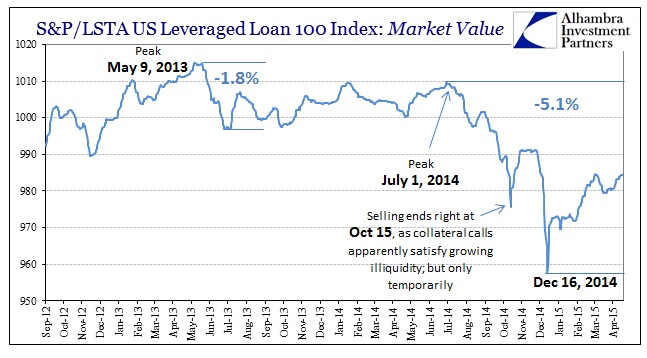
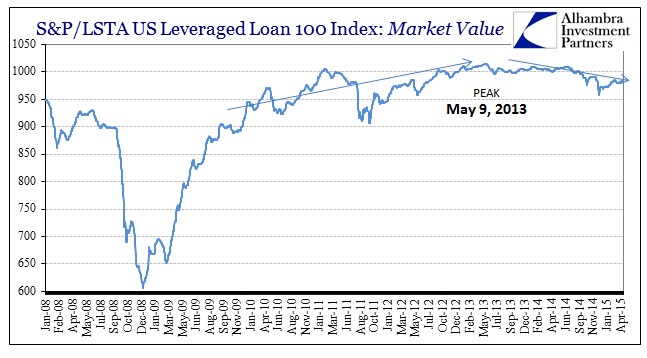
The market price trajectory for leveraged loans mimics almost exactly that of HYG (it does not really matter which is mimicking and which is representative). Whereas the ultimate peak in retail debt prices (represented by the HYG fund) was May 8, 2013, the peak for leverage loans (represented by the S&P/LSTA 100) was May 9, 2013. While both of these are only proxies for a greater market that is more unseen and illiquid, the fact that they follow each other so closely rules out a great deal of probability due to randomness or idiosyncrasies among the individual securities/indices. In other words, because these two separate market views on junk are following almost exactly the same pattern more than suggests that these interpretations apply to the real junk market and not just the individual assets.
It is downright striking and even unsettling to see the closeness in replication here. And, again, it seems to support the idea that risk appetites and enthusiasm began to wane all the way back in 2013. The fact that junk prices in 2015 remain so demoted almost a year now from the last peak near the end of June 2014 appears to be heightened risk attentiveness. Thus, it may not be so long for this end of the artificial standing that is driving at least some of the unstable economic function. Further, because this dates back almost exactly two years, you cannot attribute the energy sector alone as the primary cause or explanation (as is so often tried these days).
If there is a supercycle, this would suggest its drawing toward a close. As I said at the outset, that would be the single most important indicator for policymakers, but since they have convinced themselves, through nothing but a forced mathematical equality of rational expectations, they take this as nothing more than “markets being markets.” A systemic reset of expectations (as of now in the form of lost resiliency or buoyancy) under these economic conditions would be much, much more than that.
Stay In Touch